
Examples
Learn by example, as we navigate you through the process of building step by step.
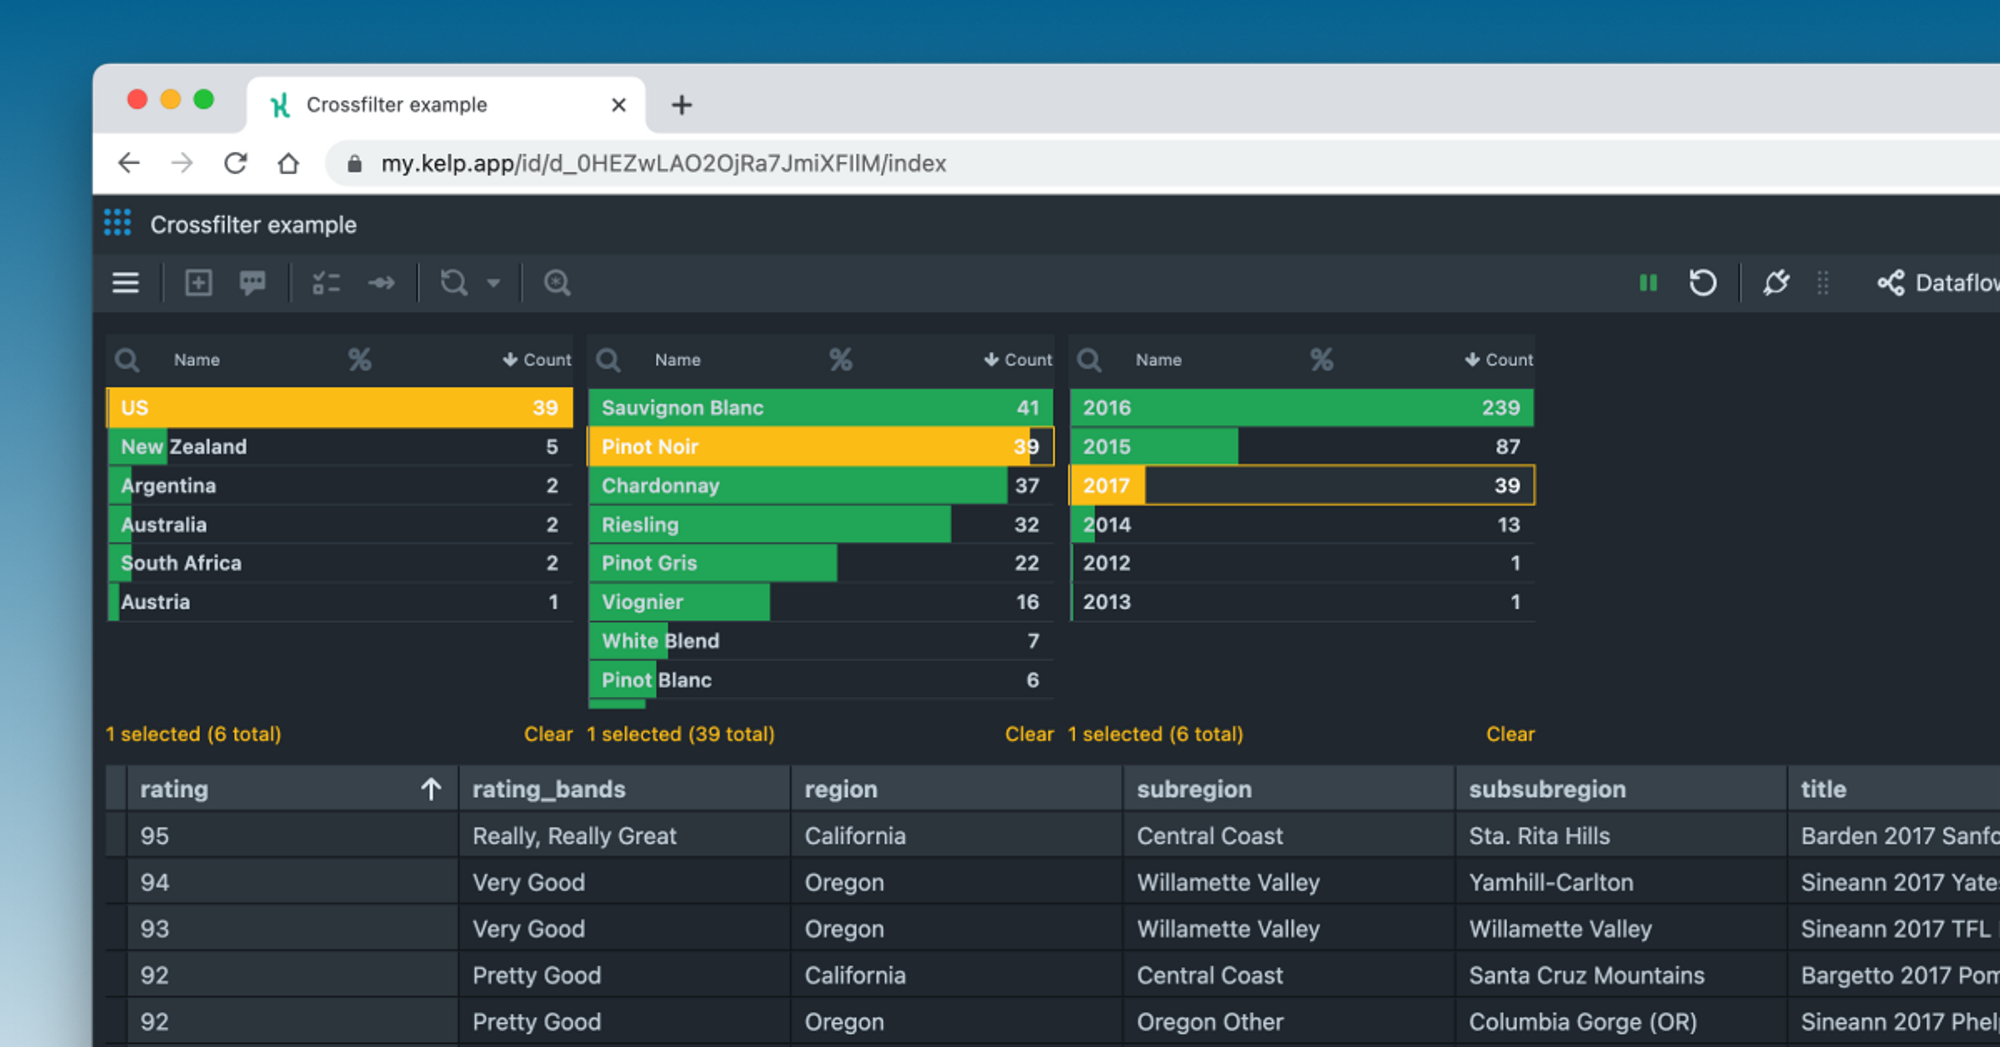
Slicing and dicing data with Crossfilter
Crossfilter is a powerful tool for interactive data visualization that allows you to slice and dice your data until you find the intended result. In this article, you’ll learn how to use Crossfilter within Kelp to build an interactive dashboard with a wine review dataset.

Kelp Team