
Introduction
Interacting with complex datasets that have multiple dimensions to find specific answers with queries made from scratch can be challenging. Most interactions involve changing a single dimension at a time. However, it can be much quicker to incrementally filter and reduce data, essentially "slicing and dicing" until the intended result is reached. This is the idea behind Crossfilter, which stems from the original Crossfilter project developed by Square, Inc. The capabilities of Crossfilter as an analysis tool make it work very well alongside interactive data visualization tools.
In this article, we will show you how to use Crossfilter within Kelp to build an interactive dashboard. You'll need a basic grasp of Kelp, so if you're not familiar with it, we recommend reading the Getting Started documentation first.
Data
Everything starts with data, and we will be using the wine reviews dataset, which is a reduced version of the full dataset available on Kaggle.
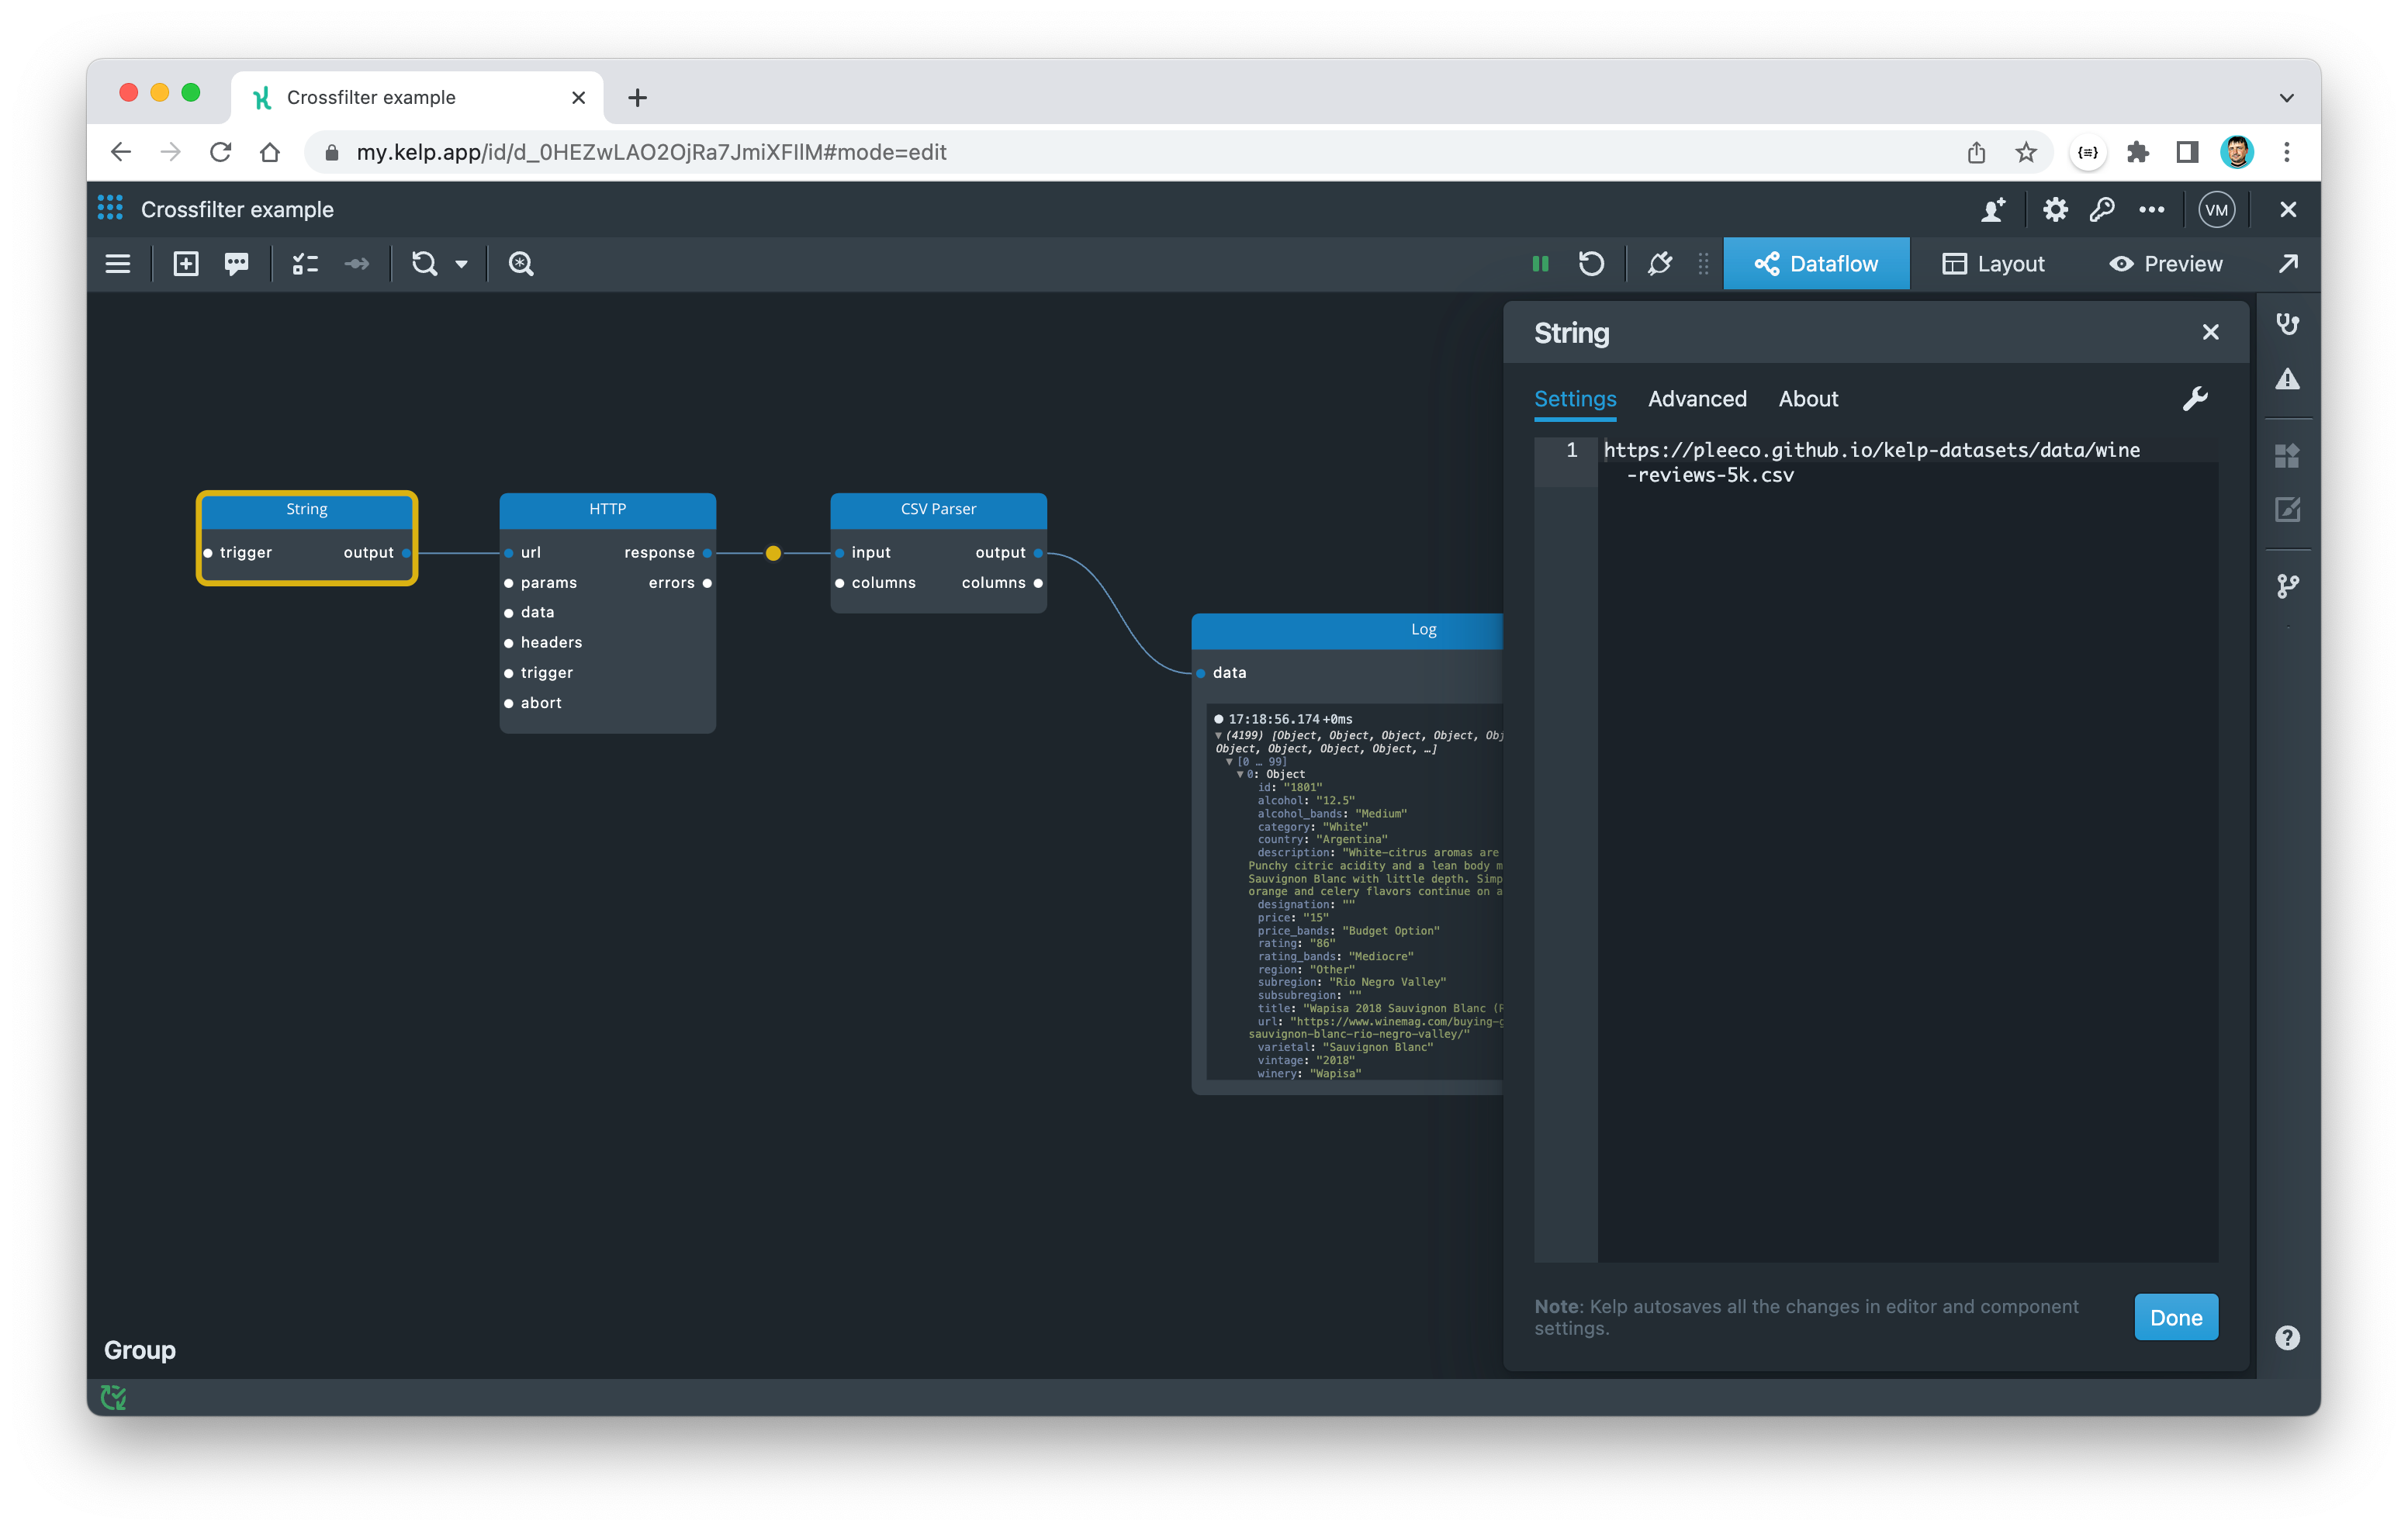
https://pleeco.github.io/kelp-datasets/data/wine-reviews-5k.csvWe dont want to reignite the age-old map battle of Beer vs. Wine. We just thought that this wine dataset could really work well in demonstrating the Crossfilter features.
Let's start by extracting data using the following dataflow graph:
If we want to find the answer to a specific question, such as "Did any Pinot Noirs from the United States in 2017 receive particularly high ratings?", we can write a query to retrieve the data for that question. However, if we want to ask another question, we would need to build another query from scratch. This can become cumbersome for more than a couple of questions. To address this, we can use interactive data visualization for a better solution.
The Crossfilter
Crossfilter provides a practical solution to a common data analysis challenge. Its functionality allows for the gradual combination of filters across multiple dimensions in order to refine a dataset to answer a specific inquiry.
It is important to have a solid understanding of the key terms associated with Crossfilter, specifically facts, dimensions, and measures. Each record within a dataset represents a factual piece of information. Dimensions refer to the specific properties that can be used to segment or group the data, while measures are the values that are calculated using the data.
In the context of our wine dataset, the facts are the individual wine entries, while the dimensions are the wine attributes like country (i.e. US), varietal (i.e. Pinot Noir), and vintage (i.e. 2017). The measure here would be the rating associated with each wine entry.
Now let's add a Crossfilter component:
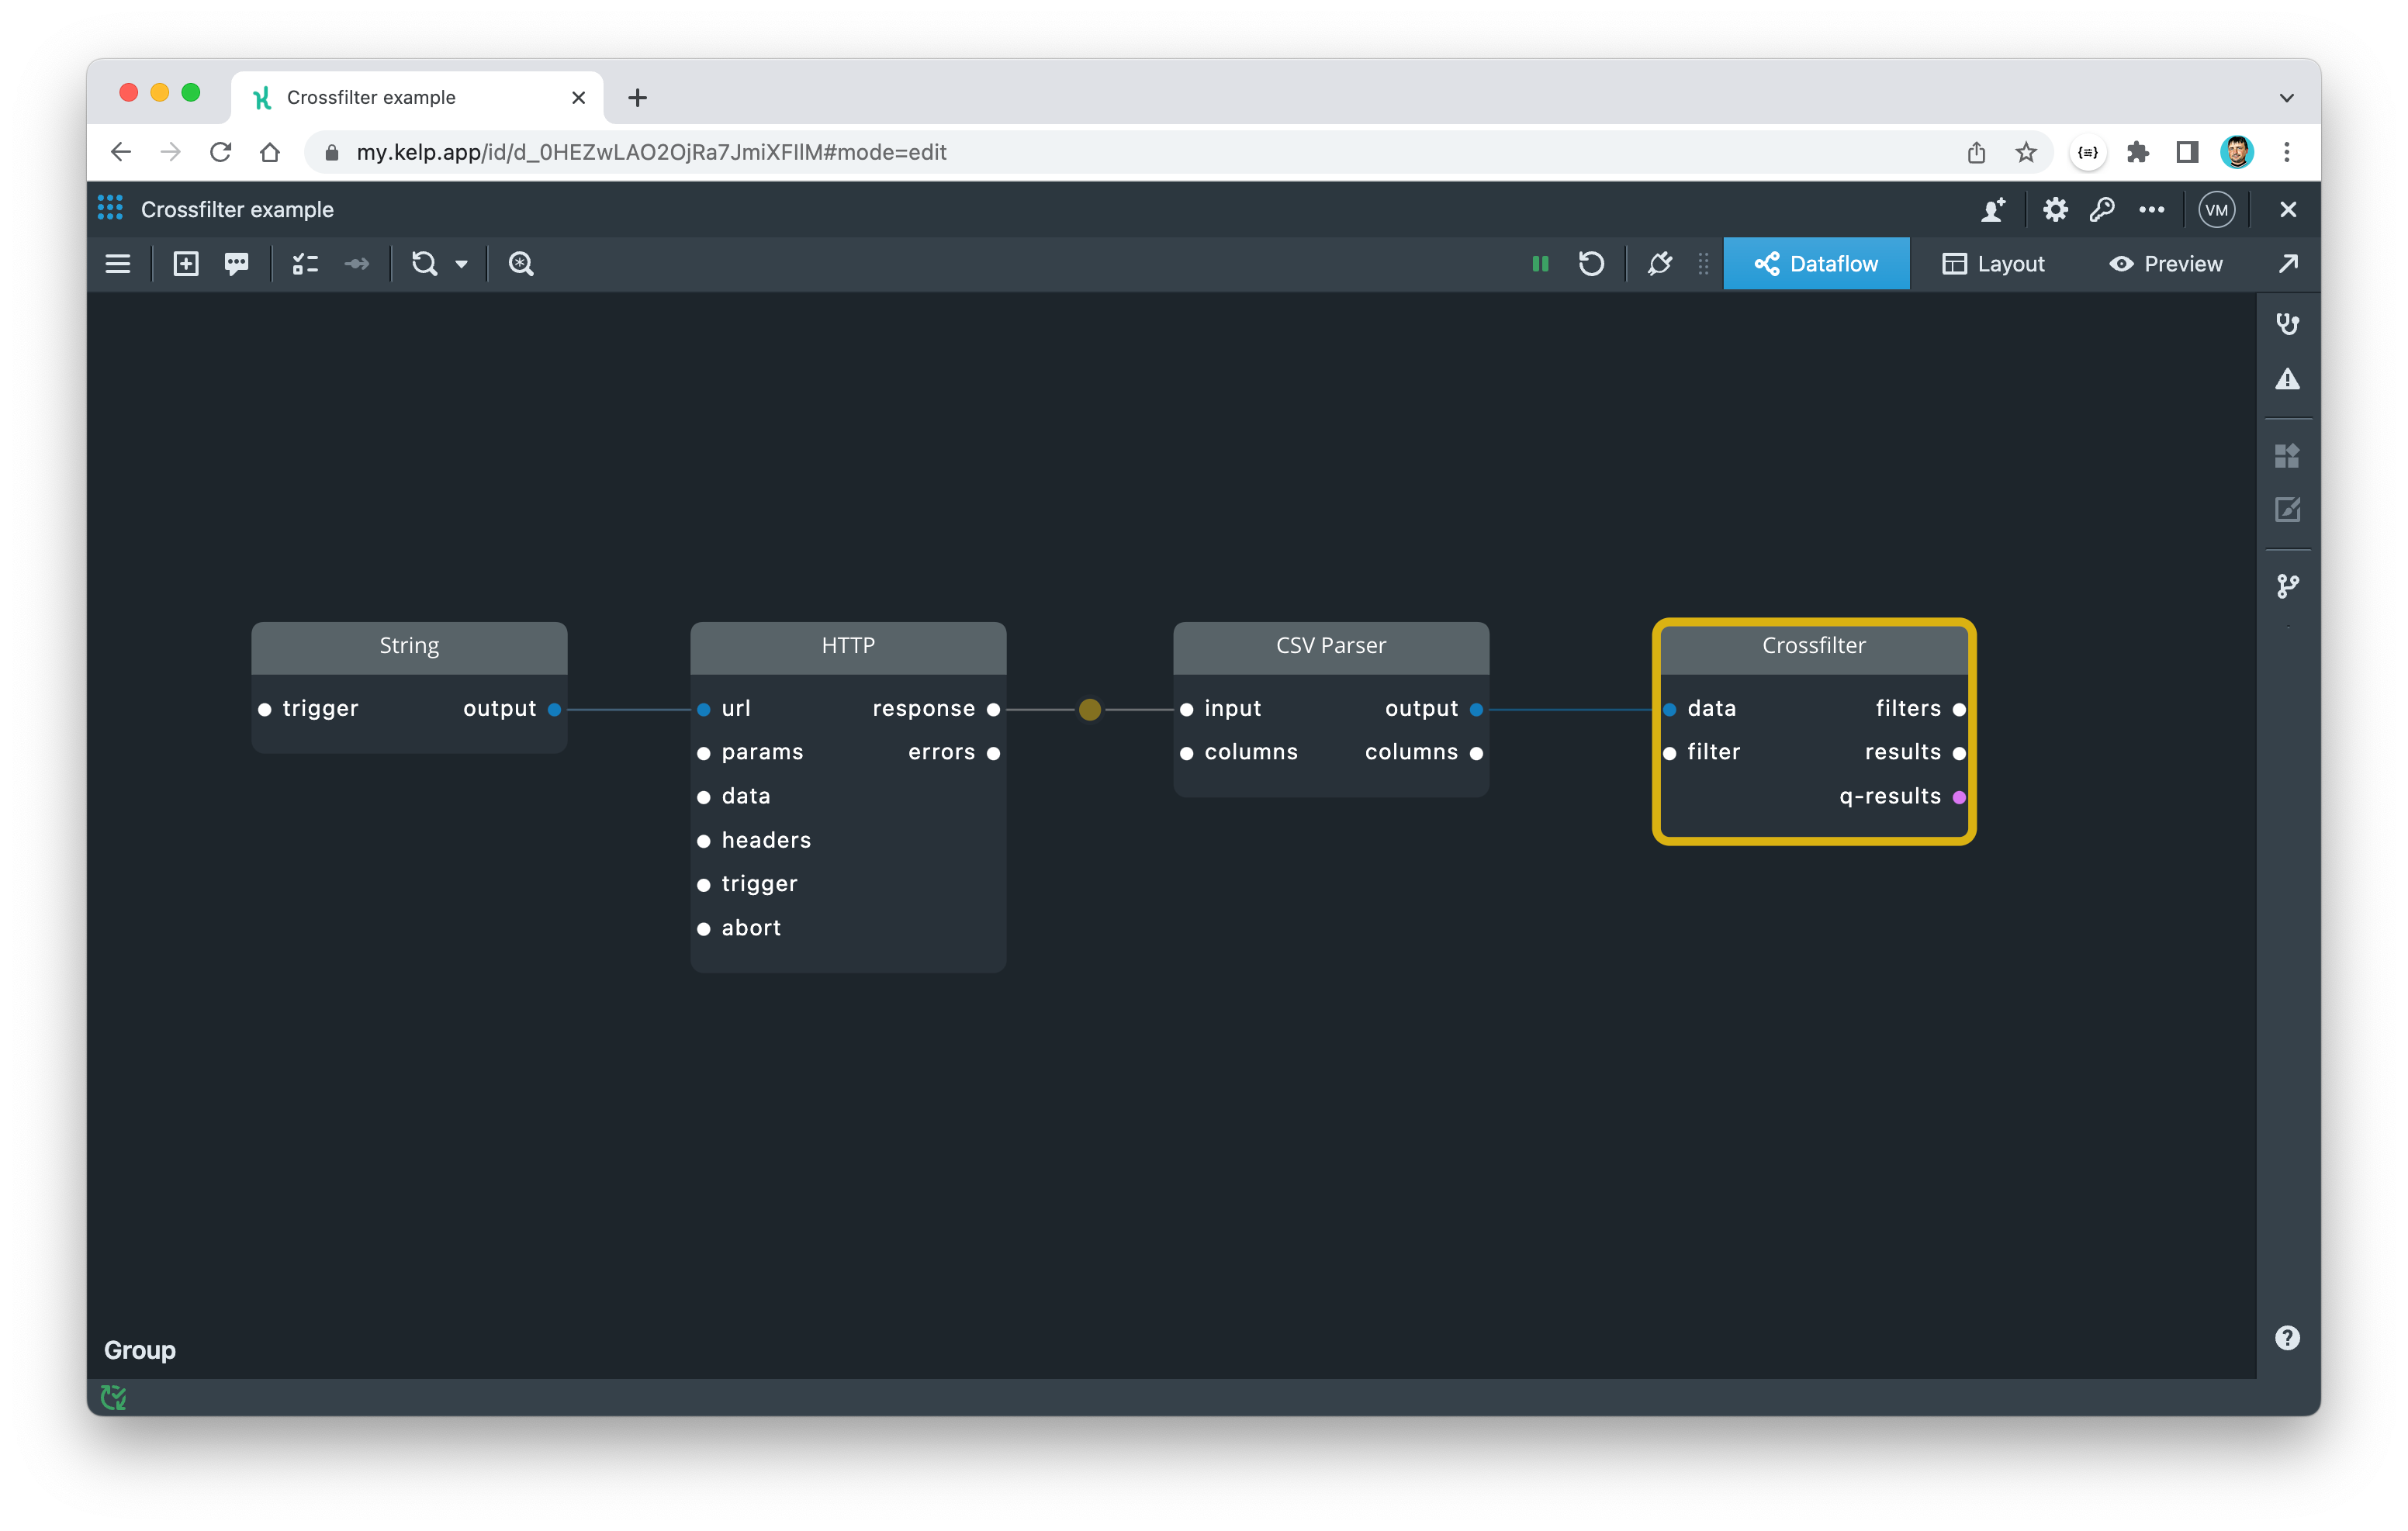
The Crossfilter component does not create filters itself, but instead acts as a hub that can calculate and apply numerous filters. Data flows into the data port, while filters are received as events through the filter port. All filters are accumulated and applied inside the Crossfilter component, and the reduced data is then generated on the results port.
We can now begin to filter our data. Let's start by creating a filter for finding all wines made in the US. This is similar to how GROUP BY works in SQL. To do this, we'll write a filter in JSON format and input it into the filter port of the Crossfilter component.
{ "field": "country", "equal": [ "US" ] }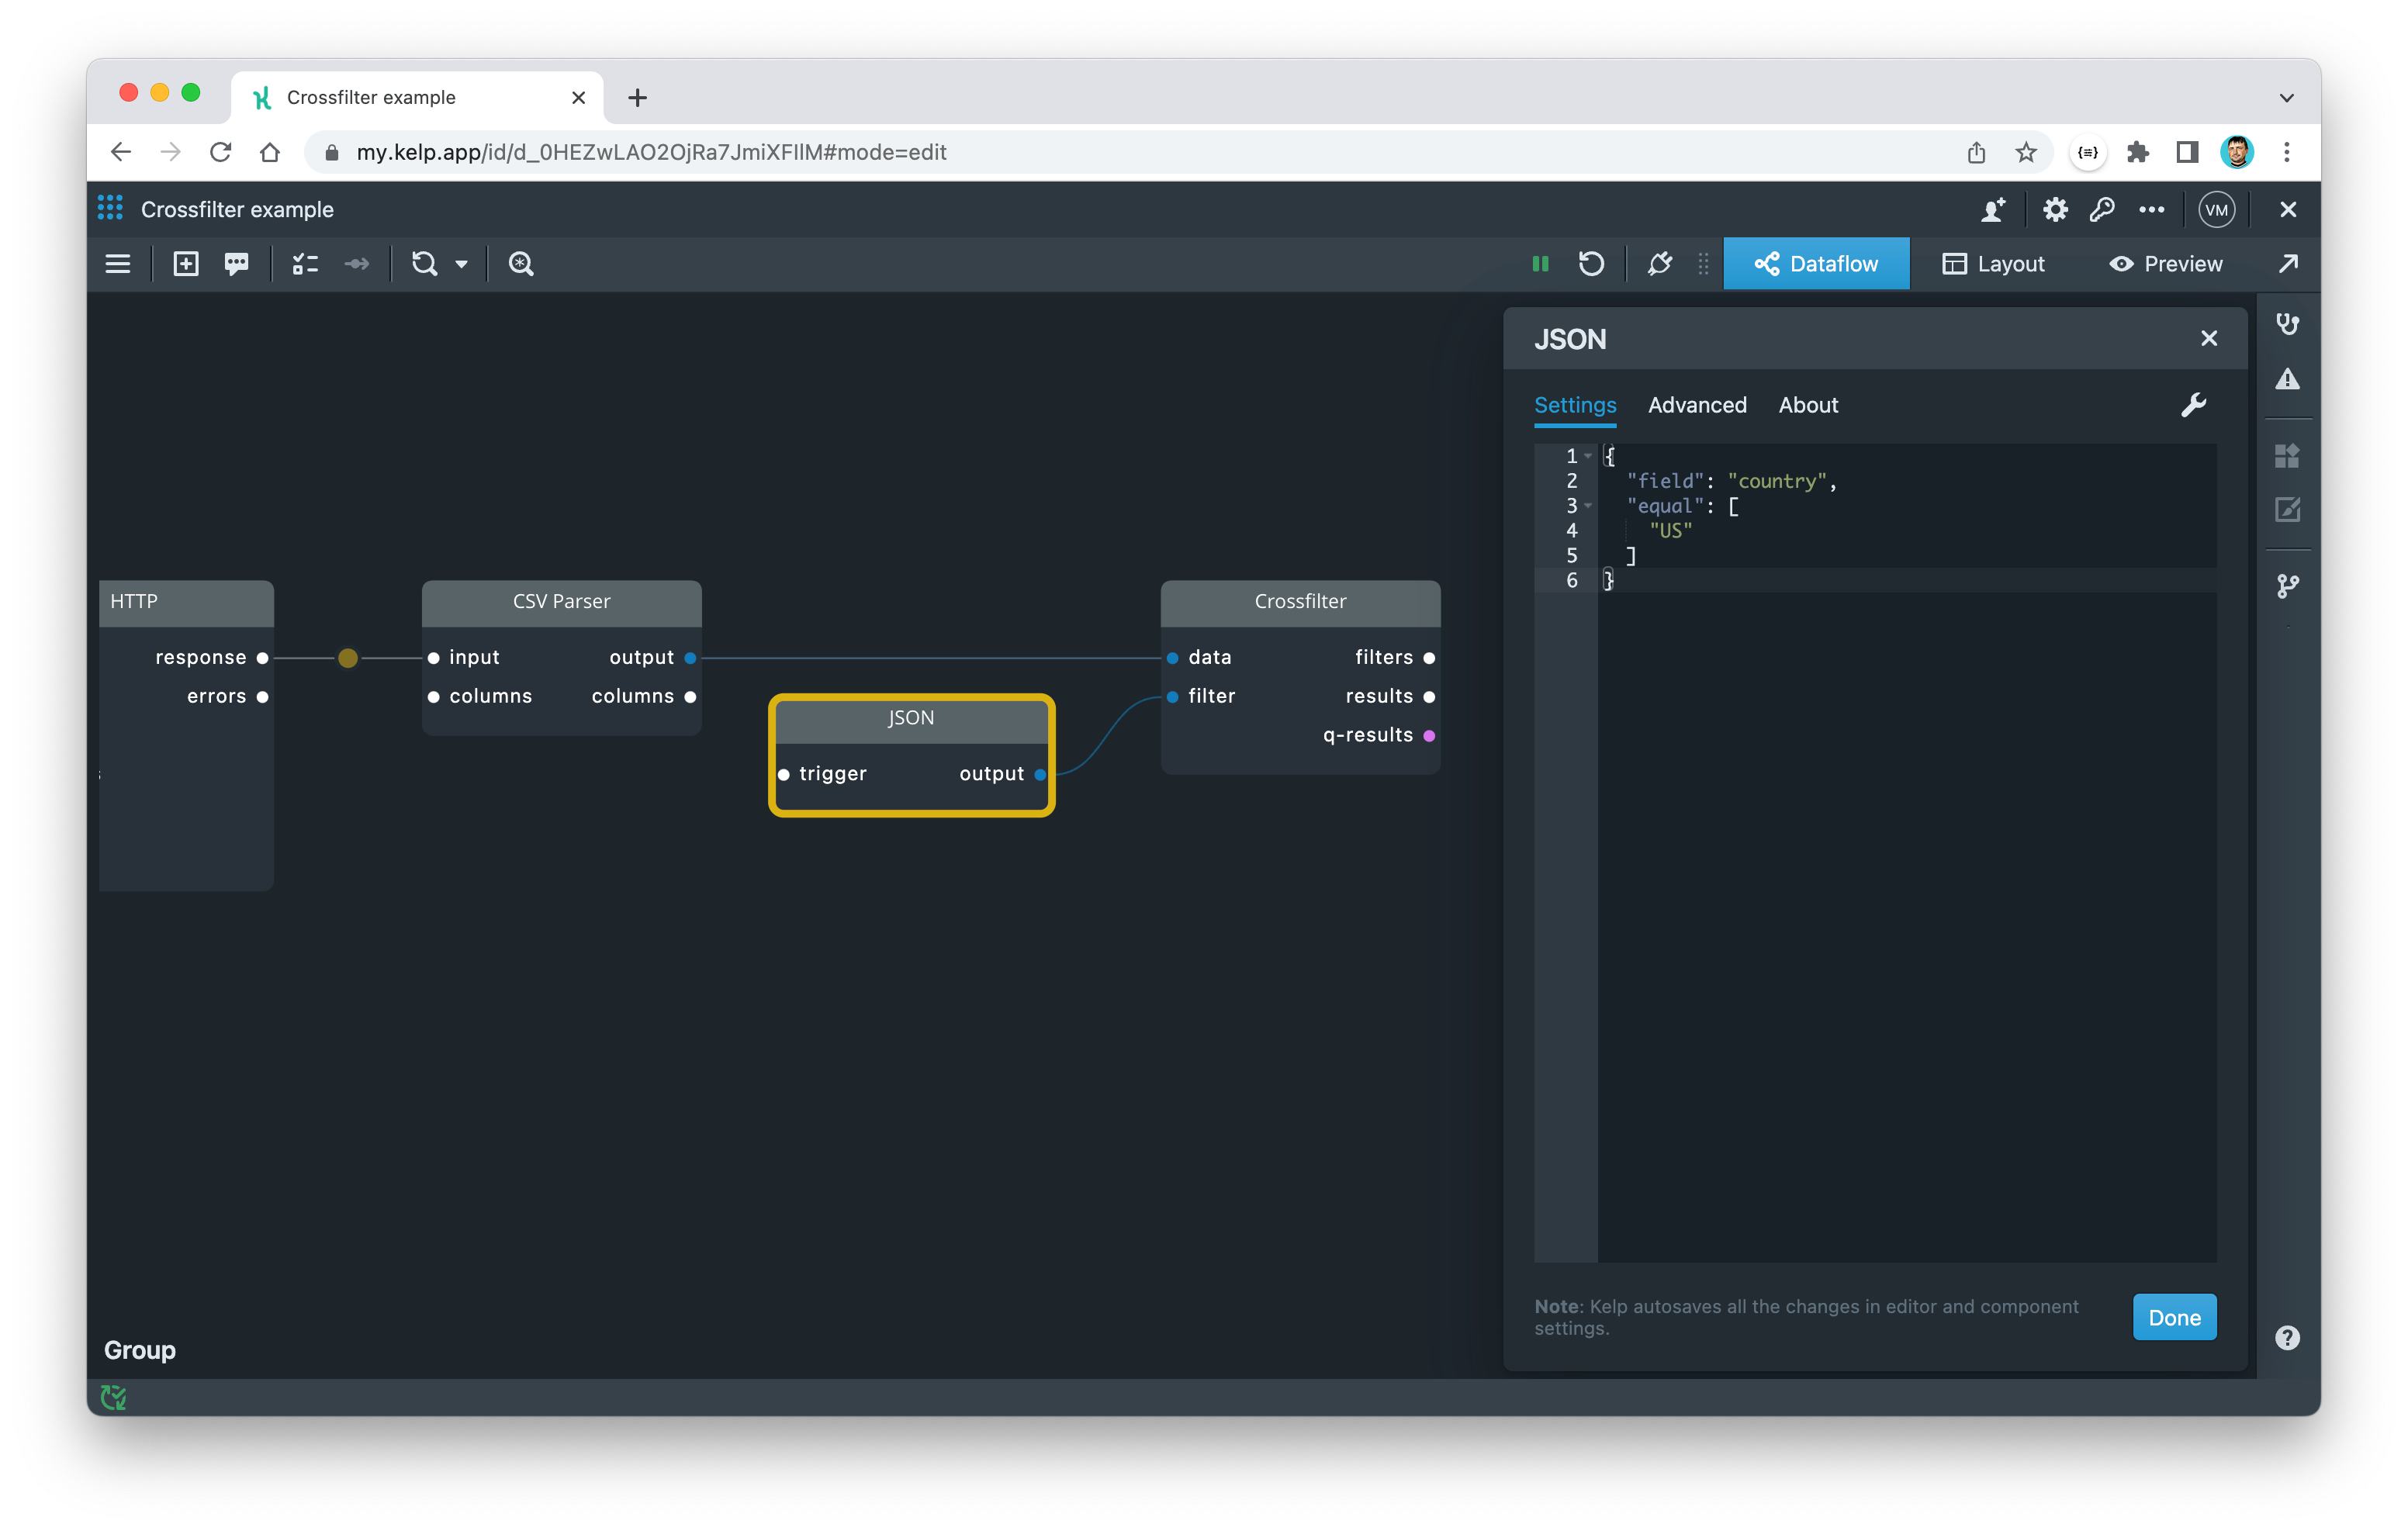
We can also create similar filters for the other two dimensions in our question and connect them to the Crossfilter component.
{ "field": "varietal", "equal": [ "Pinot Noir" ] }{ "field": "vintage", "equal": [ "2017" ] }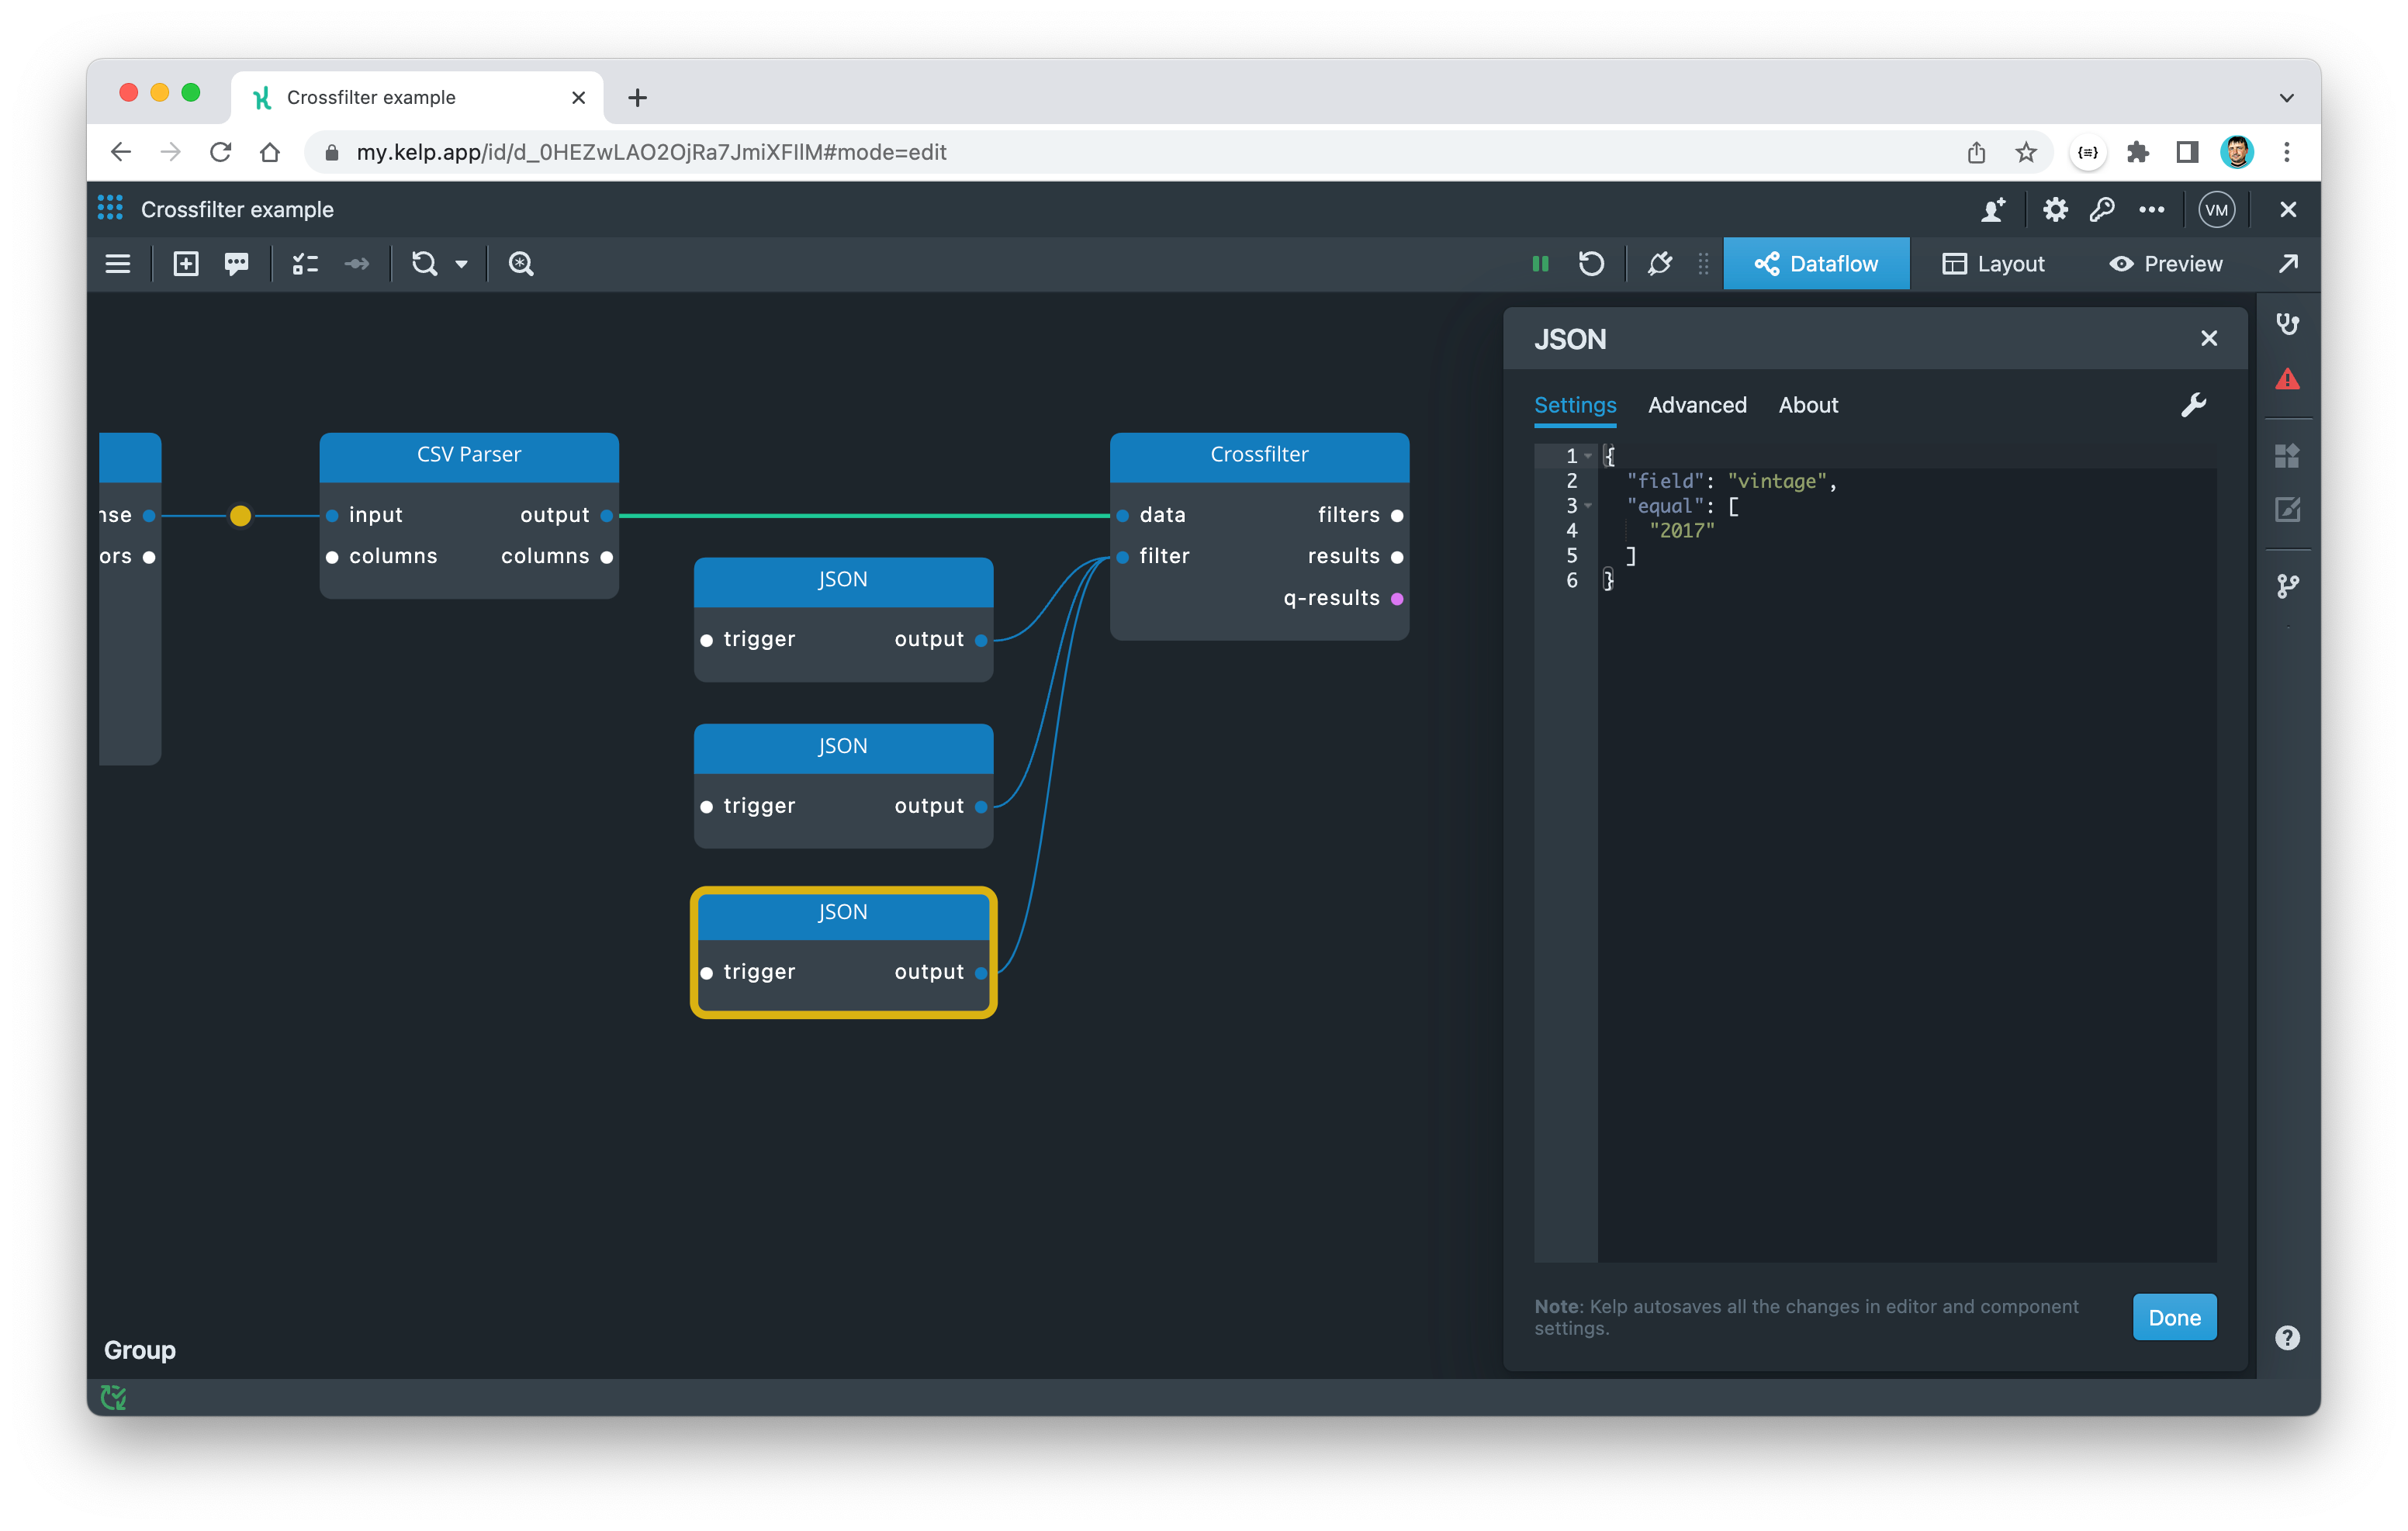
To view the results of the Crossfilter component, we can use a Table widget. To do this, we need to pipe the results from the results port into the data port of the Table widget with the following simple KelpQL transformation:
data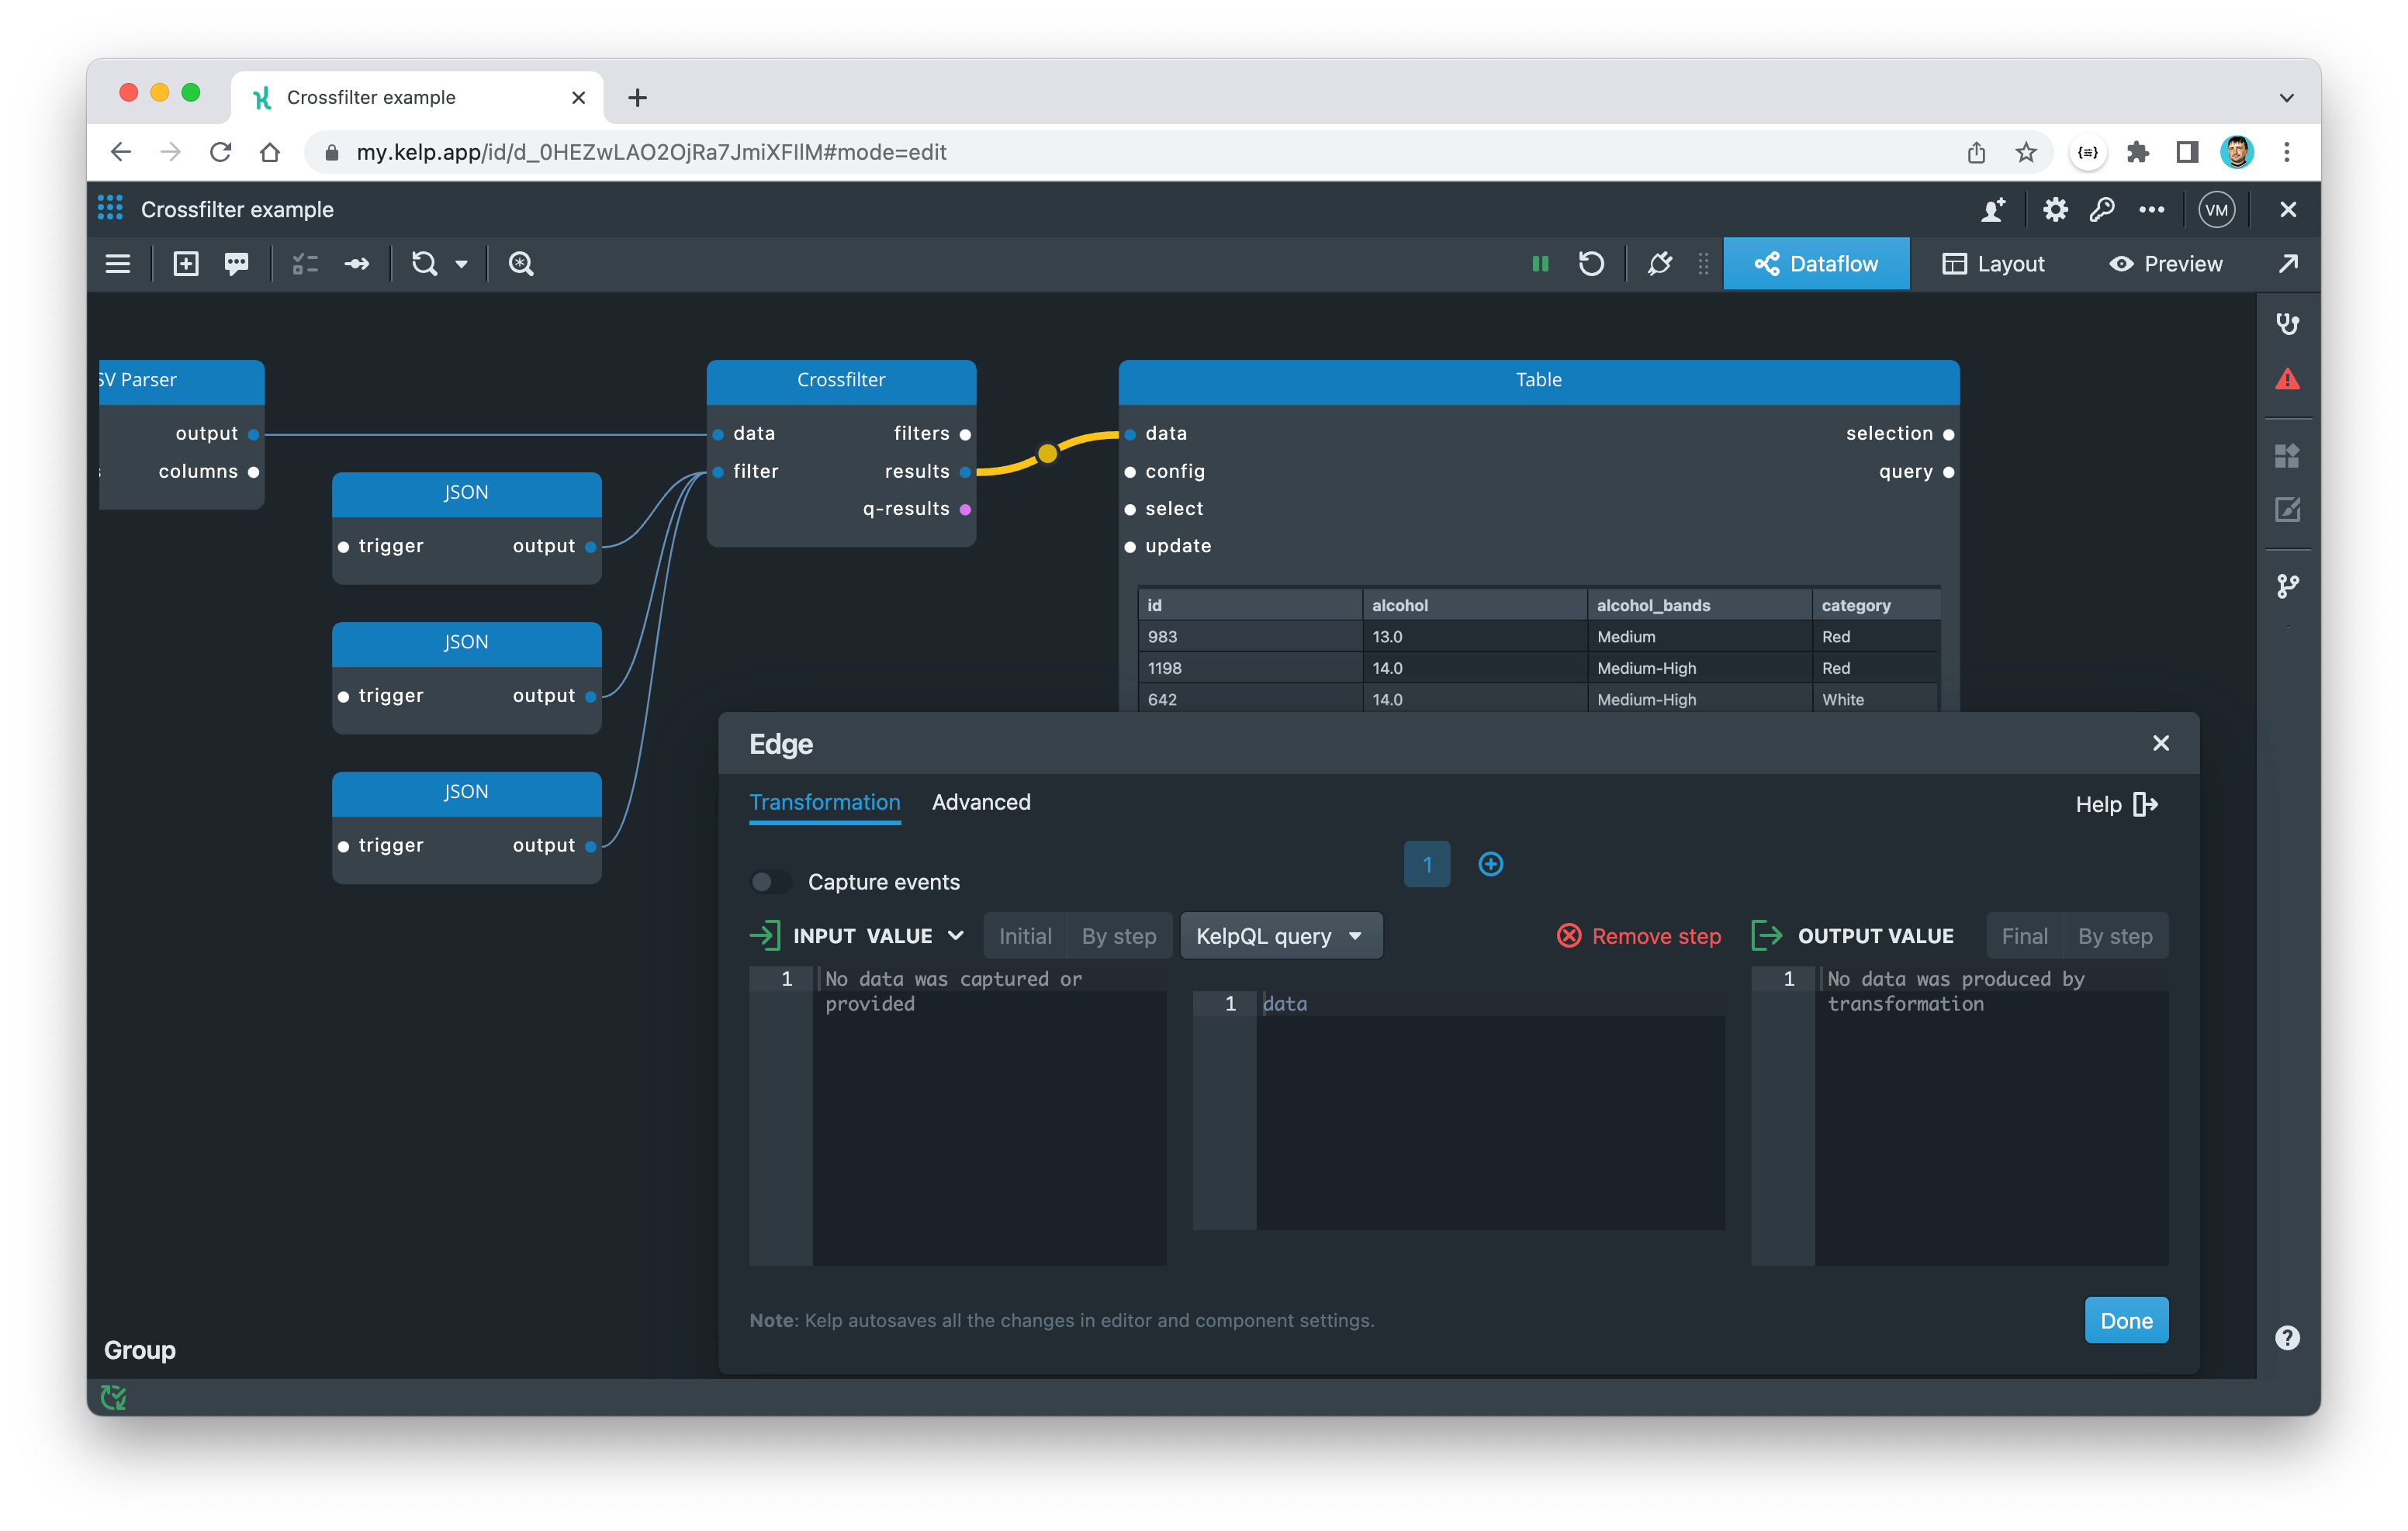
Technically, we have now answered our question, but we had to hardcode each filter, which is far from being an interactive solution.
We want to be able to retrieve any value for a particular dimension and automatically compile the corresponding filters. In Kelp, this can be achieved easily with the Crossfilter Dimension component.
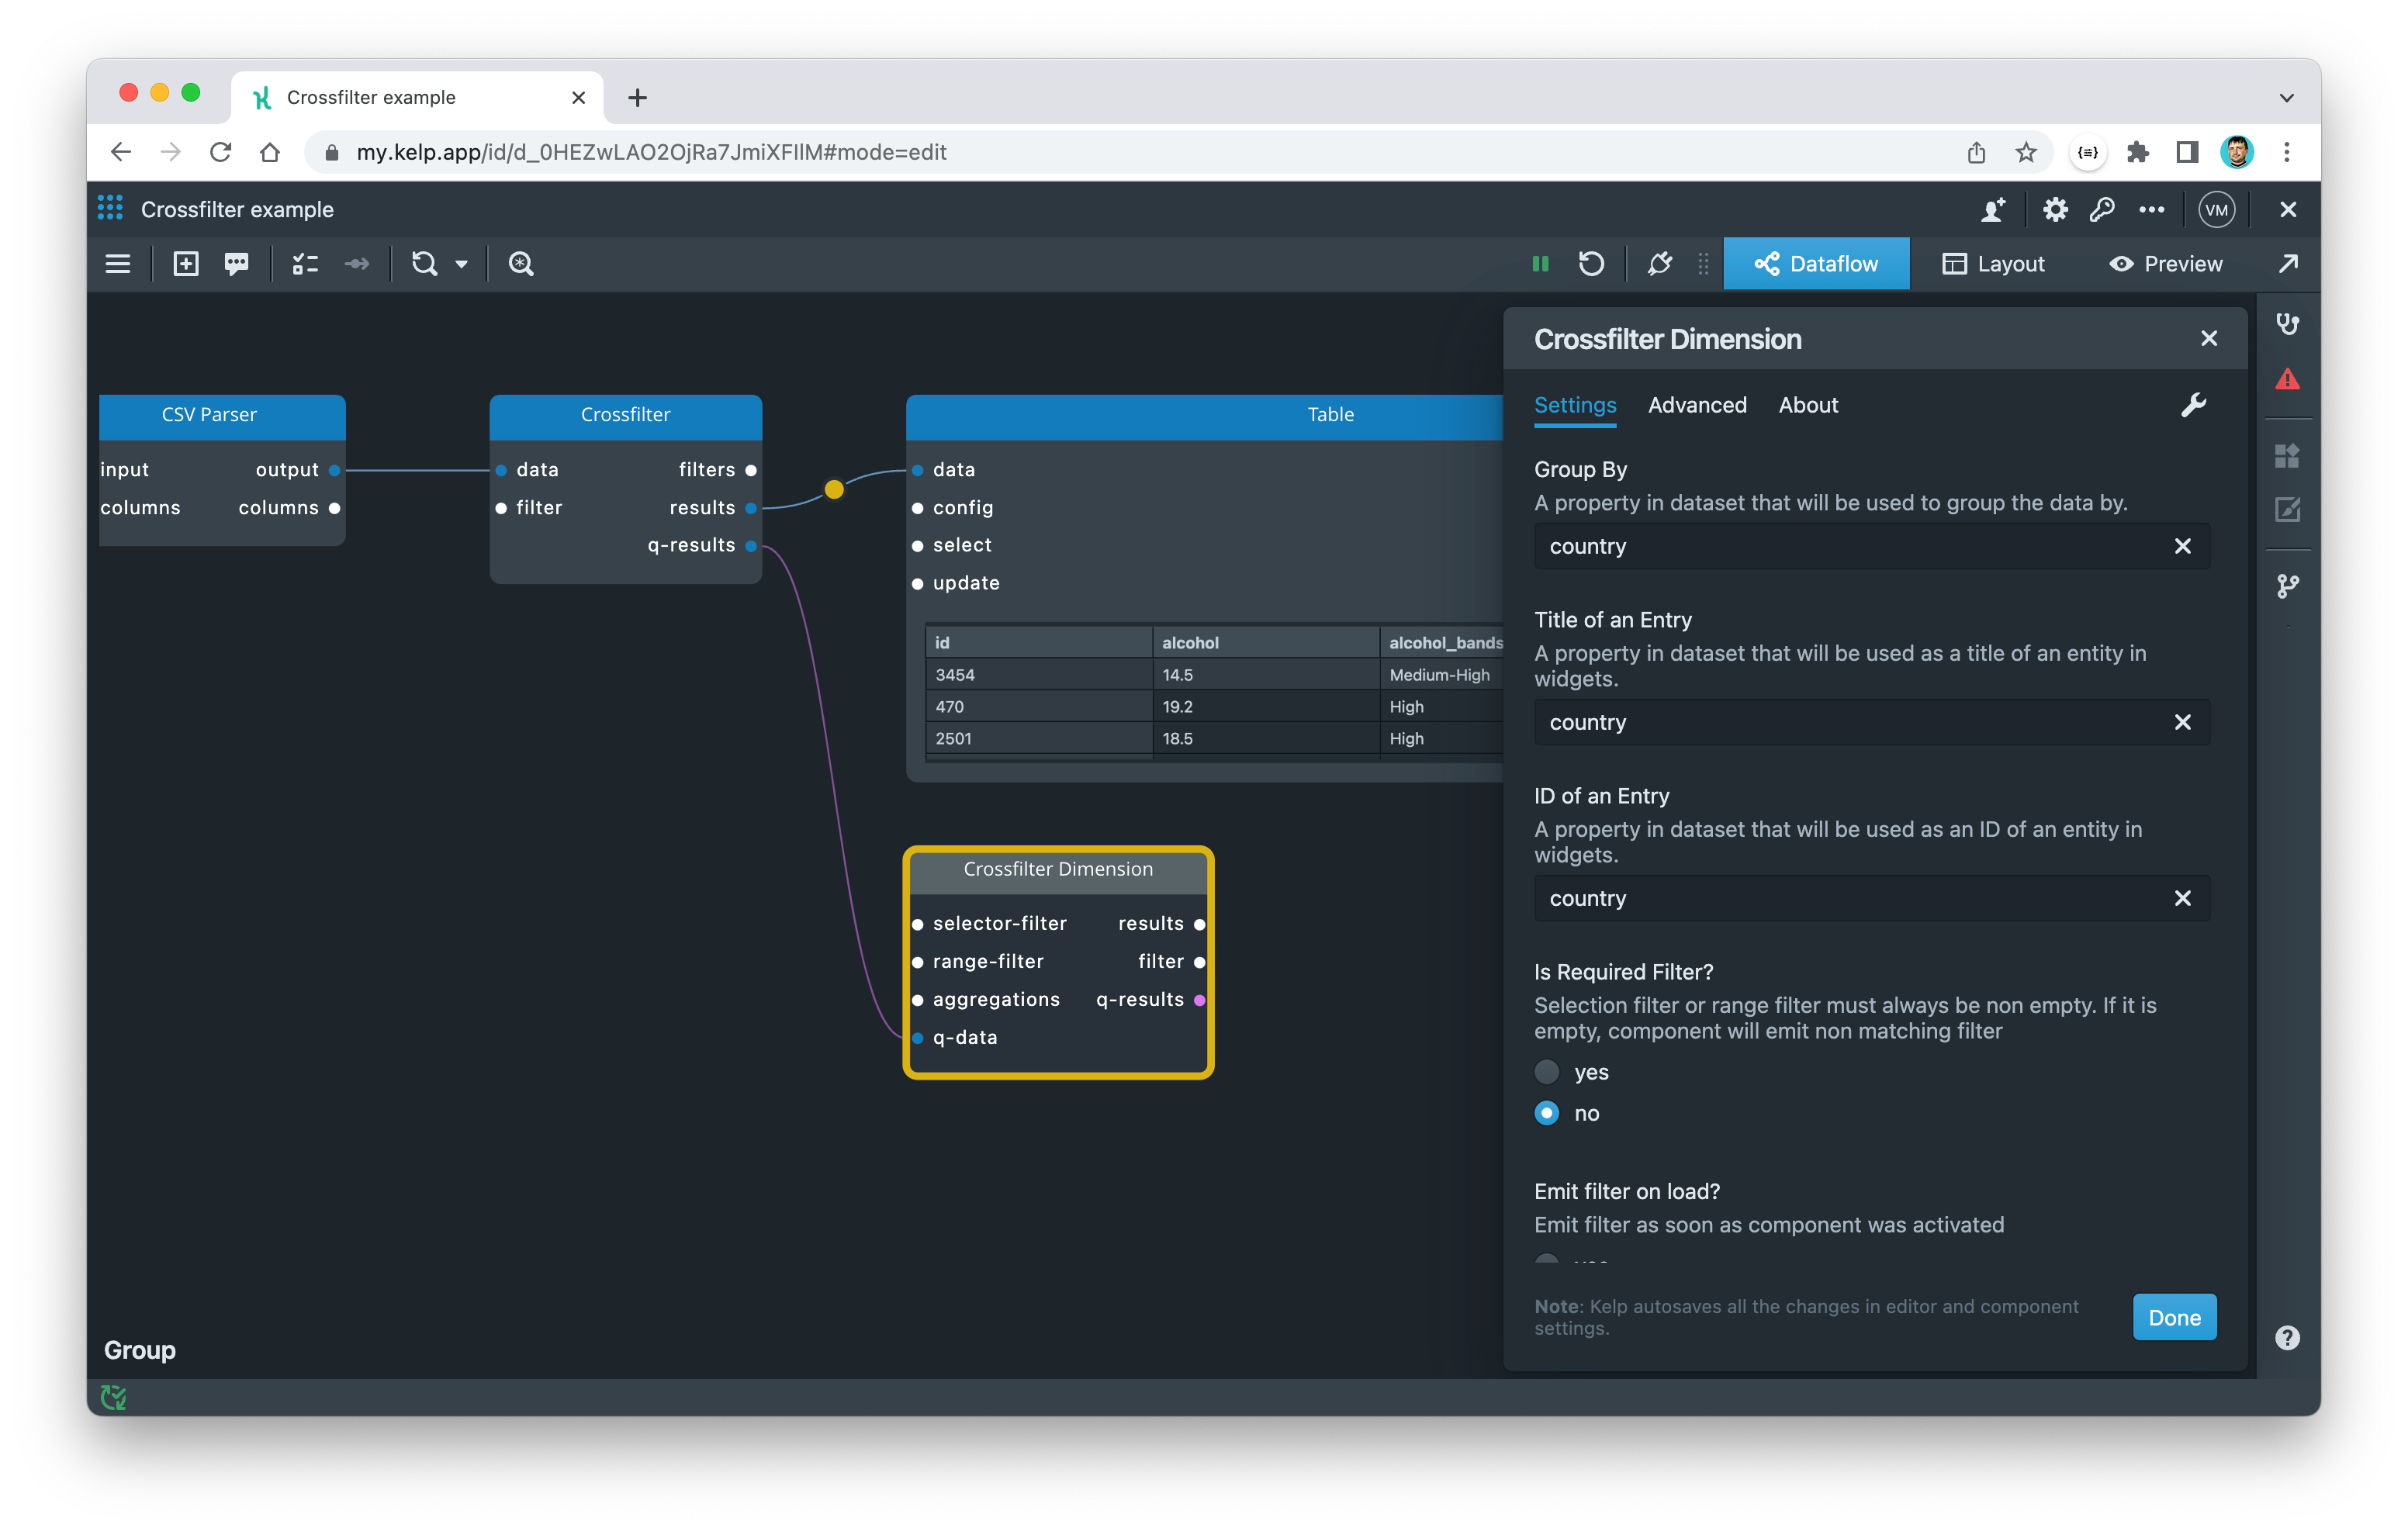
The Crossfilter Dimension component is similar to a SQL GROUP BY statement. It retrieves all the unique values for the specified dimension and is able to automatically construct filter queries for the Crossfilter component. You can specify which property the dataset will be grouped by in the component's settings dialog.
Go ahead and remove the individual filters that were connected to Crossfilter component. Then, configure the Crossfilter Dimension component instance for country dimension.
💡Tip! To send groupby parameters to Crossfilter component and receive back the resulting data, the Crossfilter Dimension component communicates with Crossfilter component using bi-directional wire called q-wire. This wire is pink-ish and connect to a special port called q-port. The Crossfilter Dimension component also uses this wire to request various updates from the Crossfilter component, such as sorting and pagination.
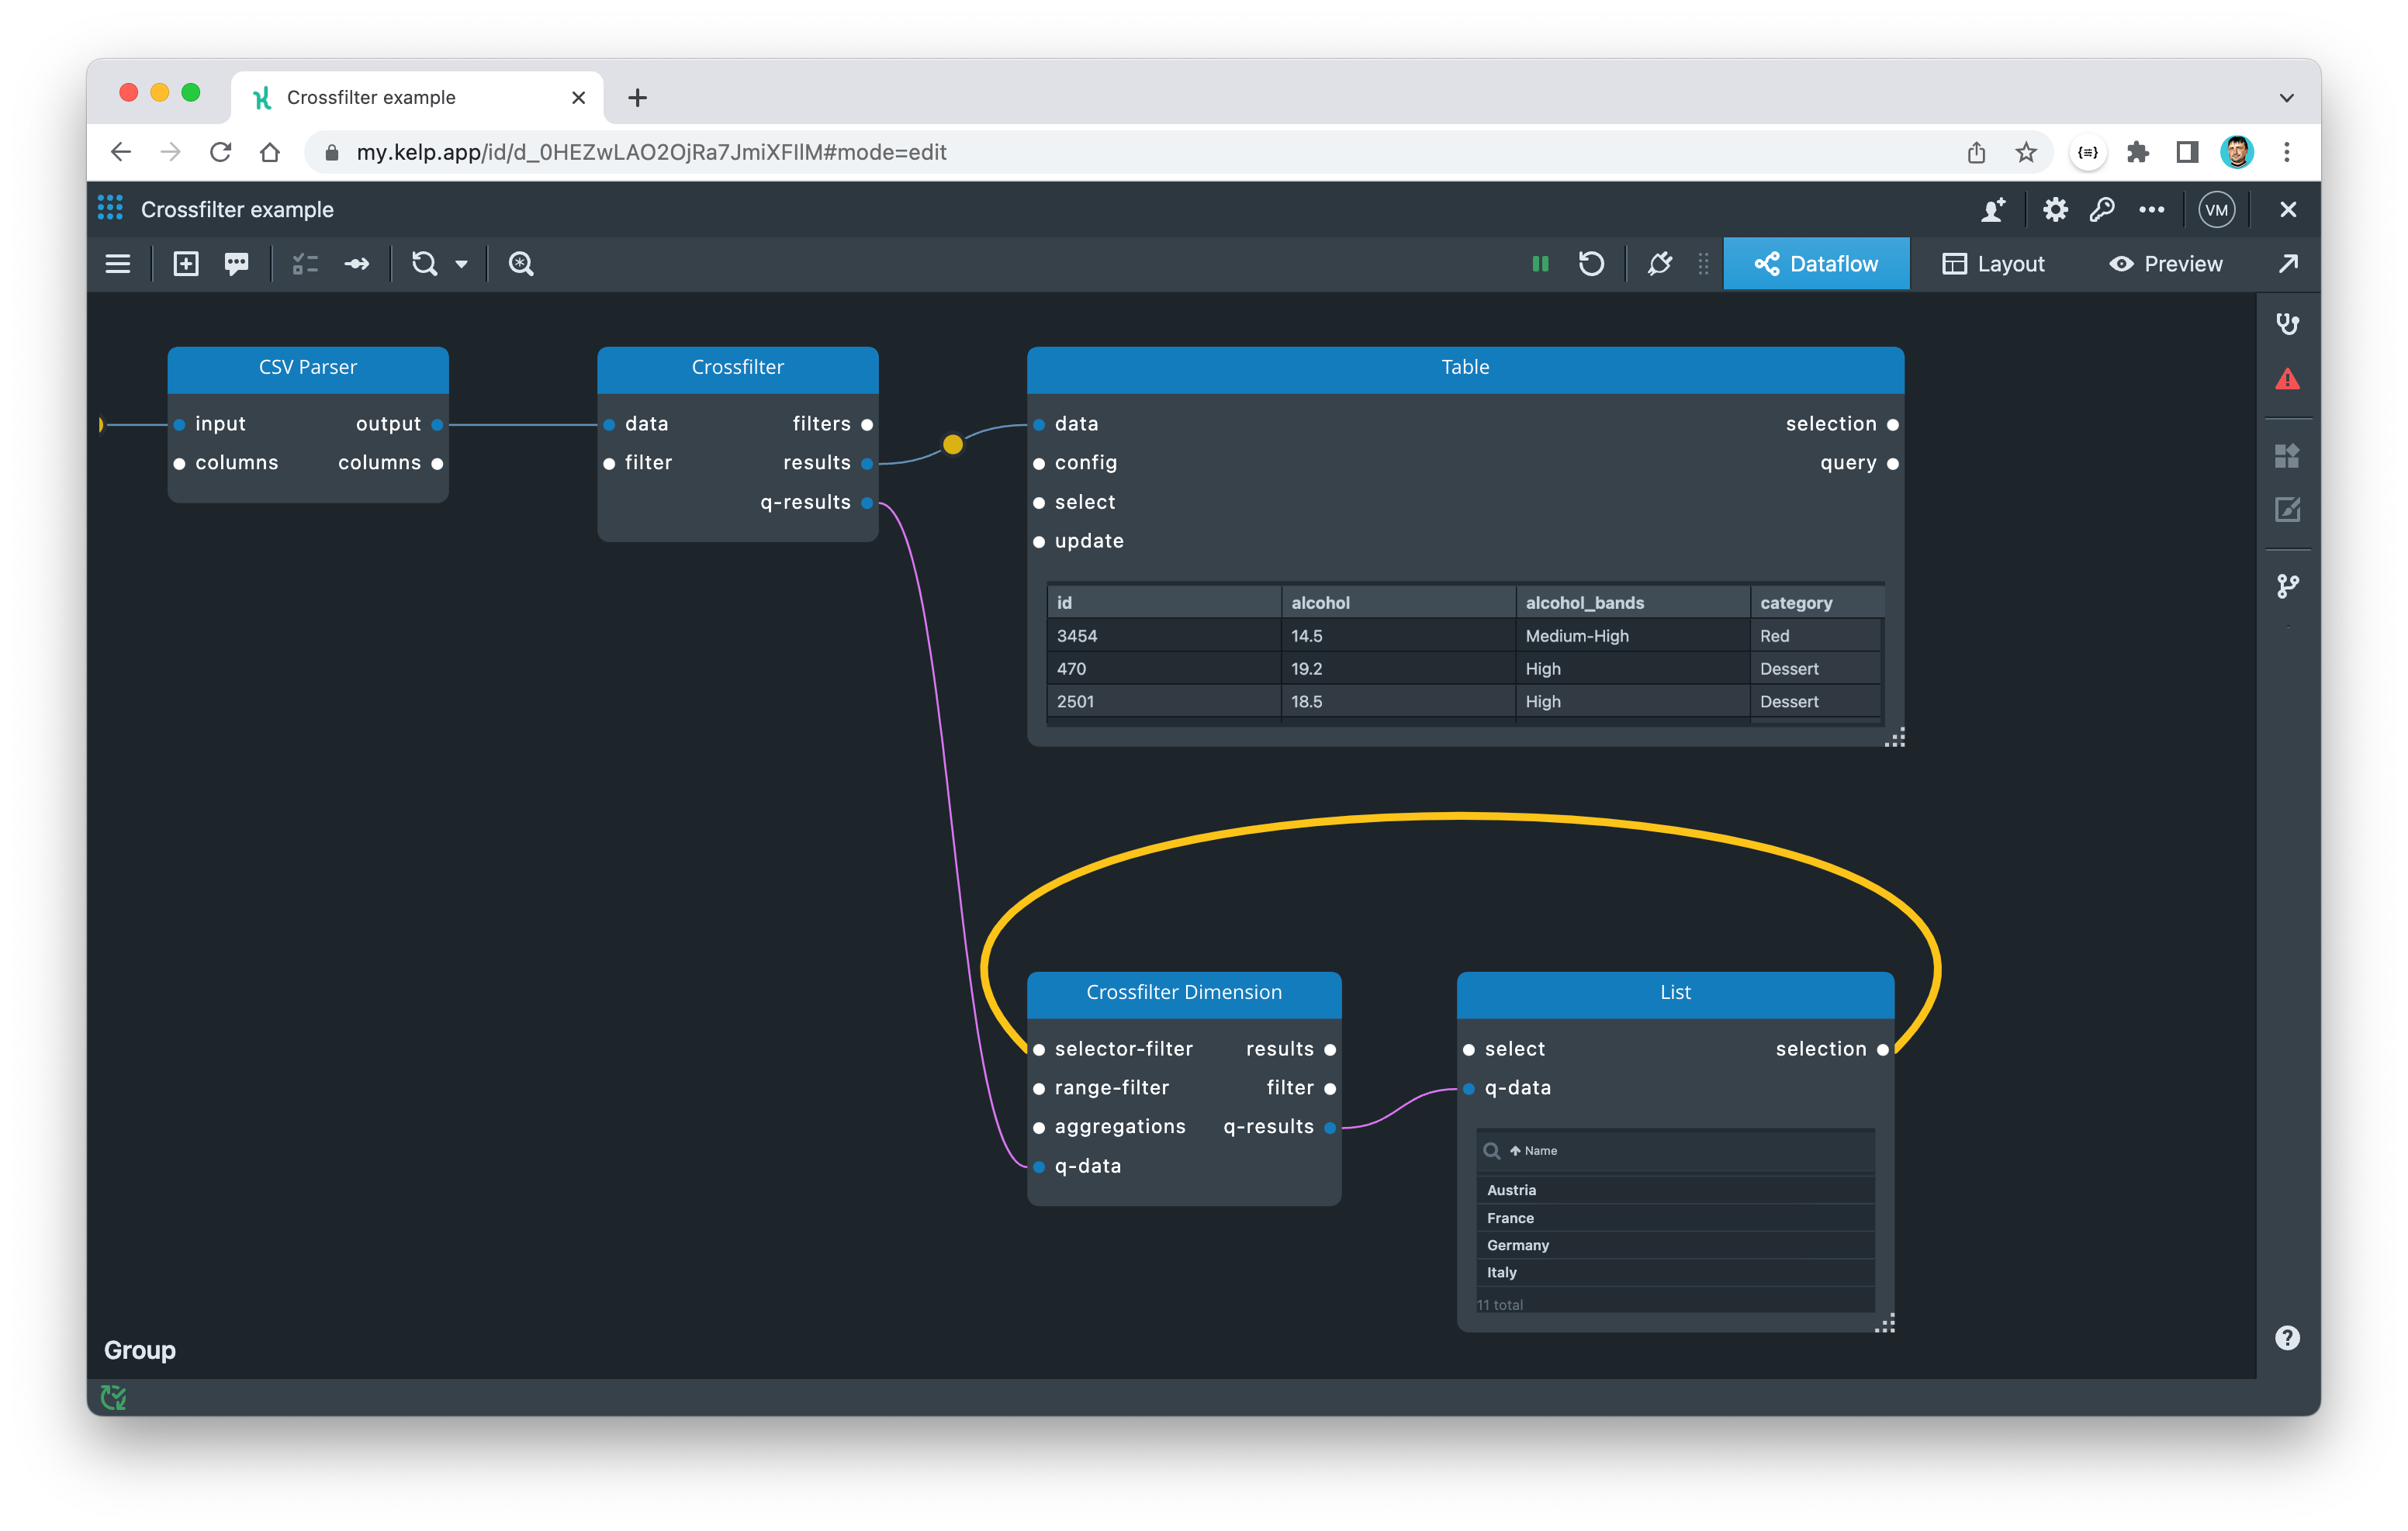
To display the unique values for the configured dimension, we can use the List widget, which is specifically designed to work with Crossfilter component. It will show a list of all the values for our dimension and provide a representation that we can use to select the values. Connect the q-results output port of the Crossfilter Dimension component to the q-data input port of the List widget.
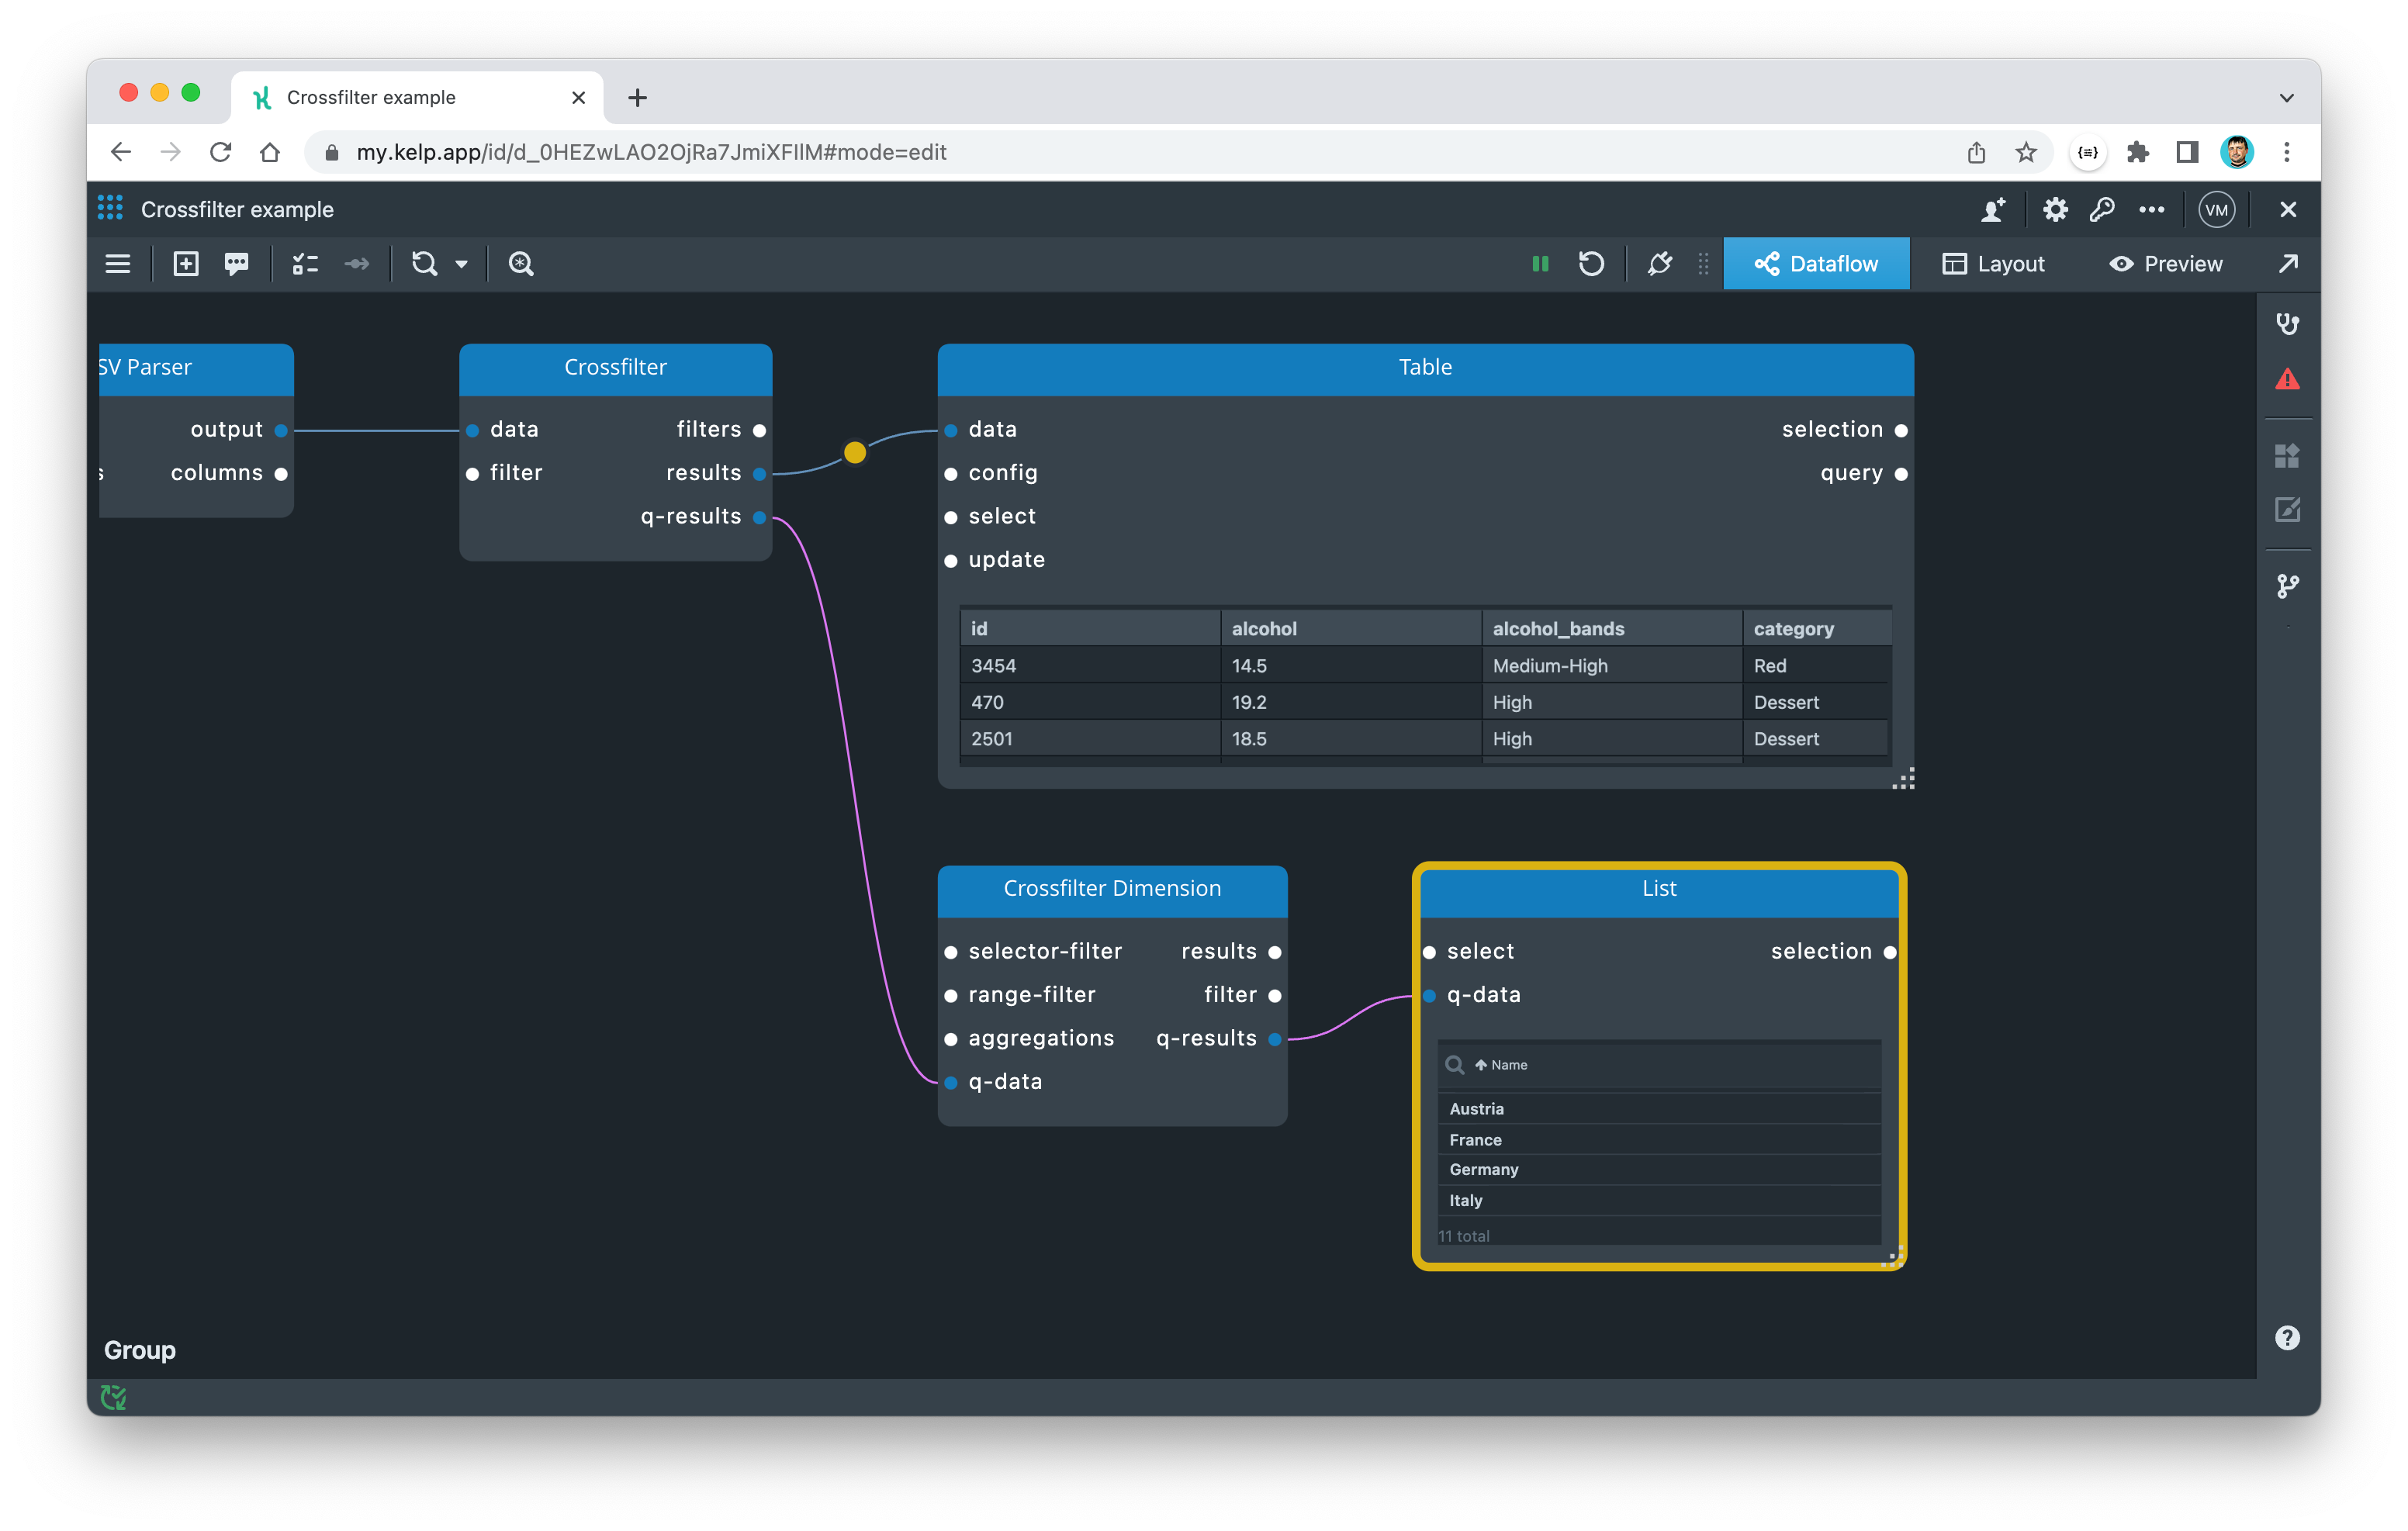
To make our app more interactive, we want to allow the user to click on a value in the List widget and have our data cross-filtered automatically. To accomplish this, we need to capture the user's selection from the List widget (on the selection port) and send it back to the Crossfilter Dimension component (on the selection-filter port).
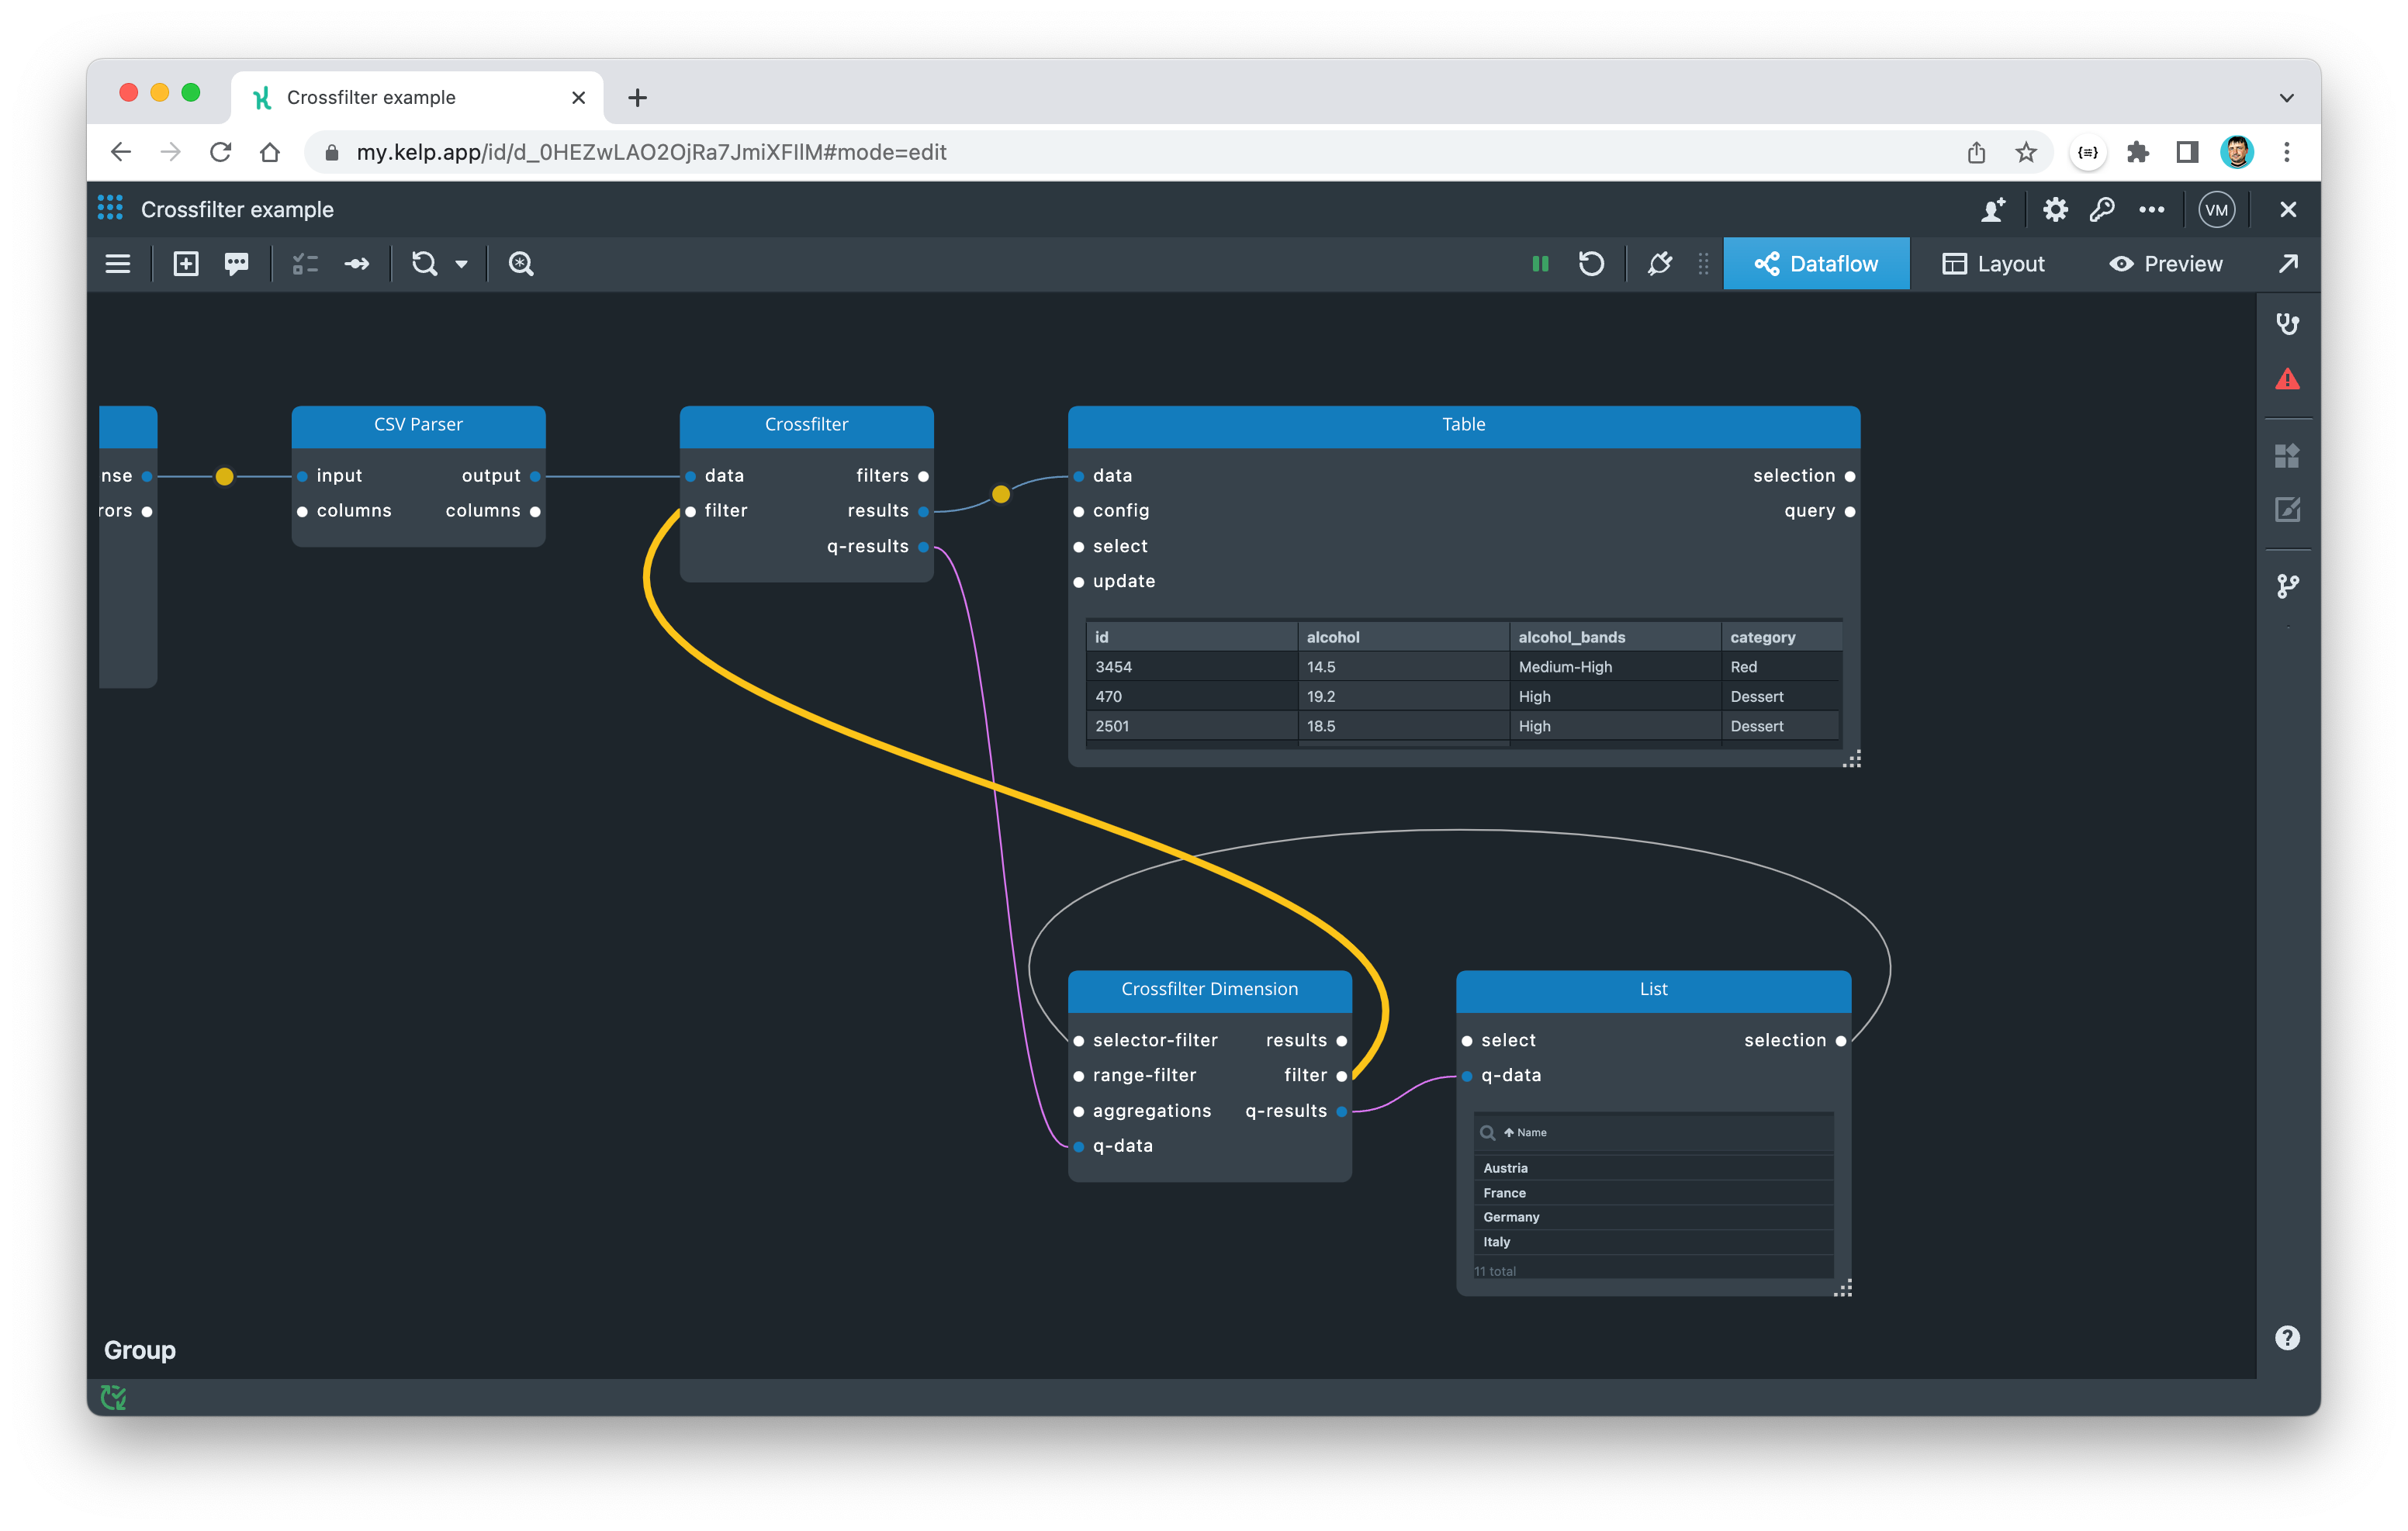
When the user selects a country, the Crossfilter Dimension component receives the country's name and creates a corresponding filter query. Next, we need to send this filter from the filter port of the Crossfilter Dimension component to the filter port of the Crossfilter component. Once the Crossfilter component receives any new or updated filters, it will recalculate the results and automatically update all connected components (i.e. Crossfilter Dimension components and List widgets).
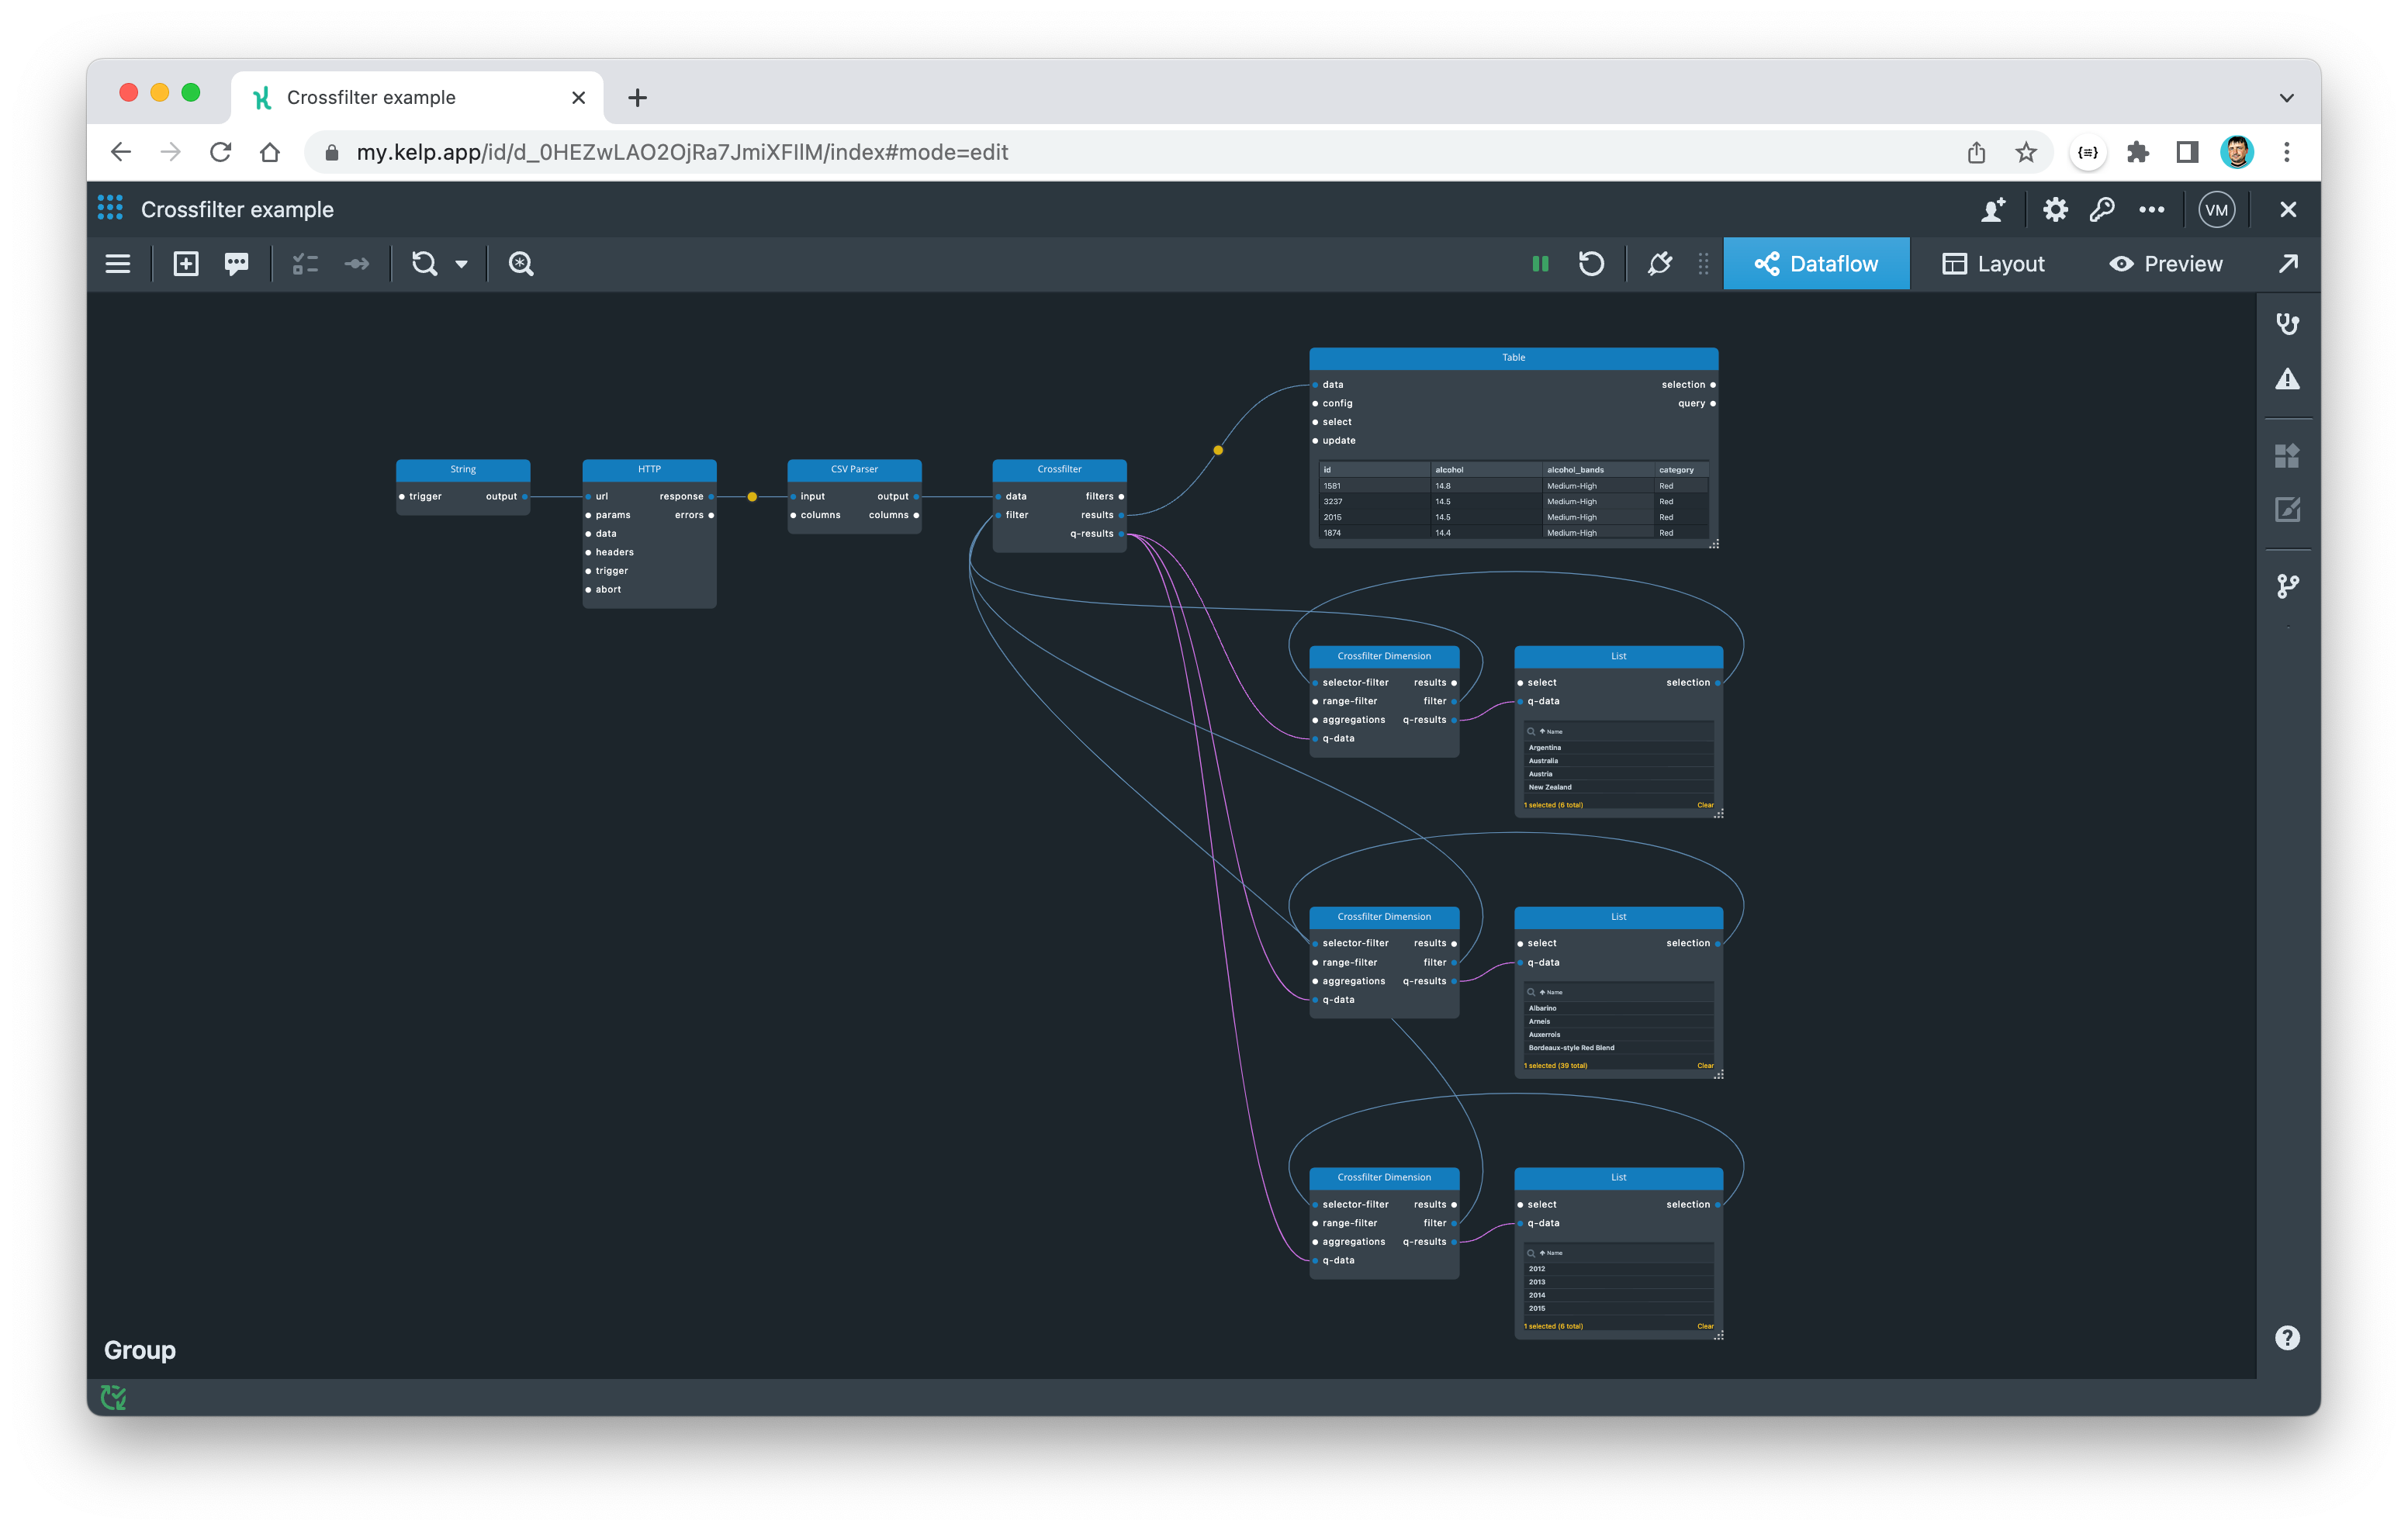
To answer the initial question, "Did any Pinot Noirs from the United States in 2017 receive particularly high ratings?", we need to set up Crossfilter Dimension components for the "varietal" and "vintage" properties as well. This will allow us to select not only the US, Pinot Noir, and 2017 values, but also any other combination.
Place and configure two additional Crossfilter Dimensions components using the dimension names "varietal" and "vintage".
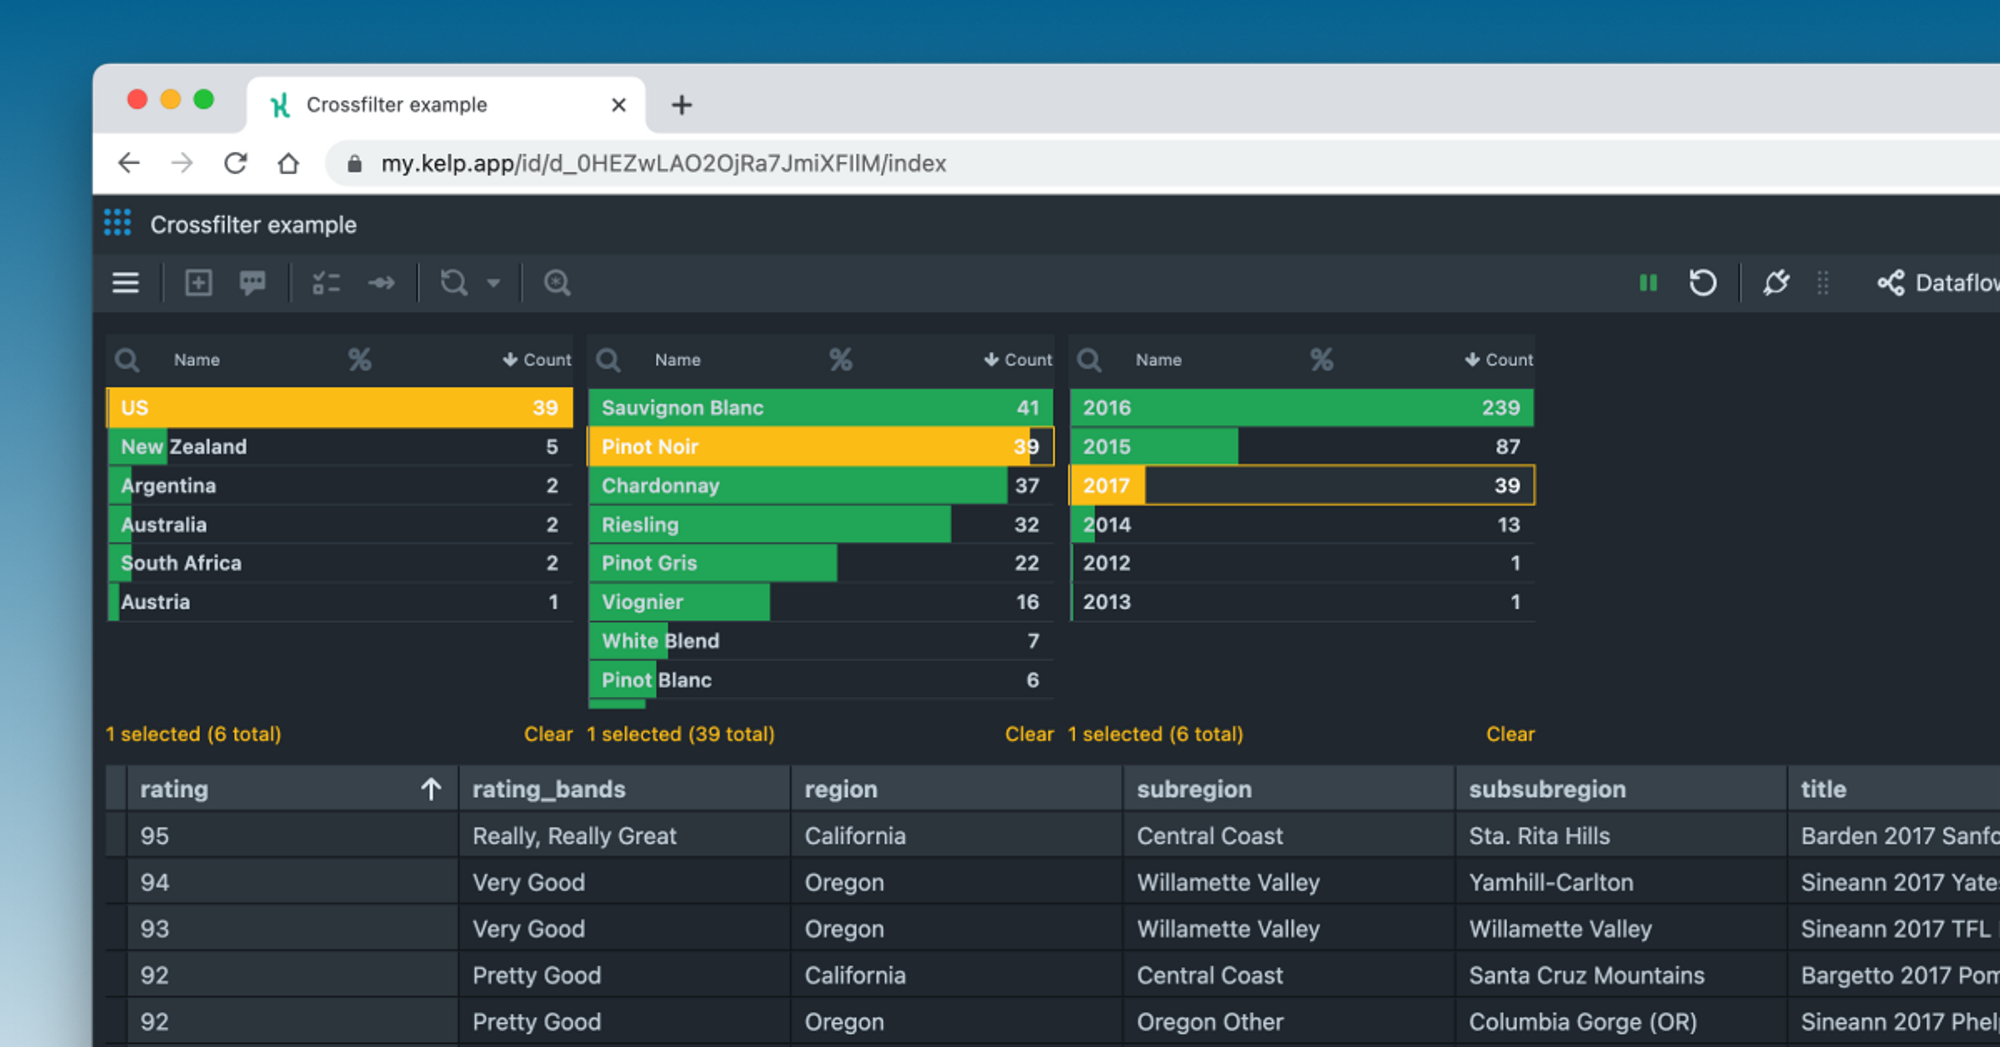
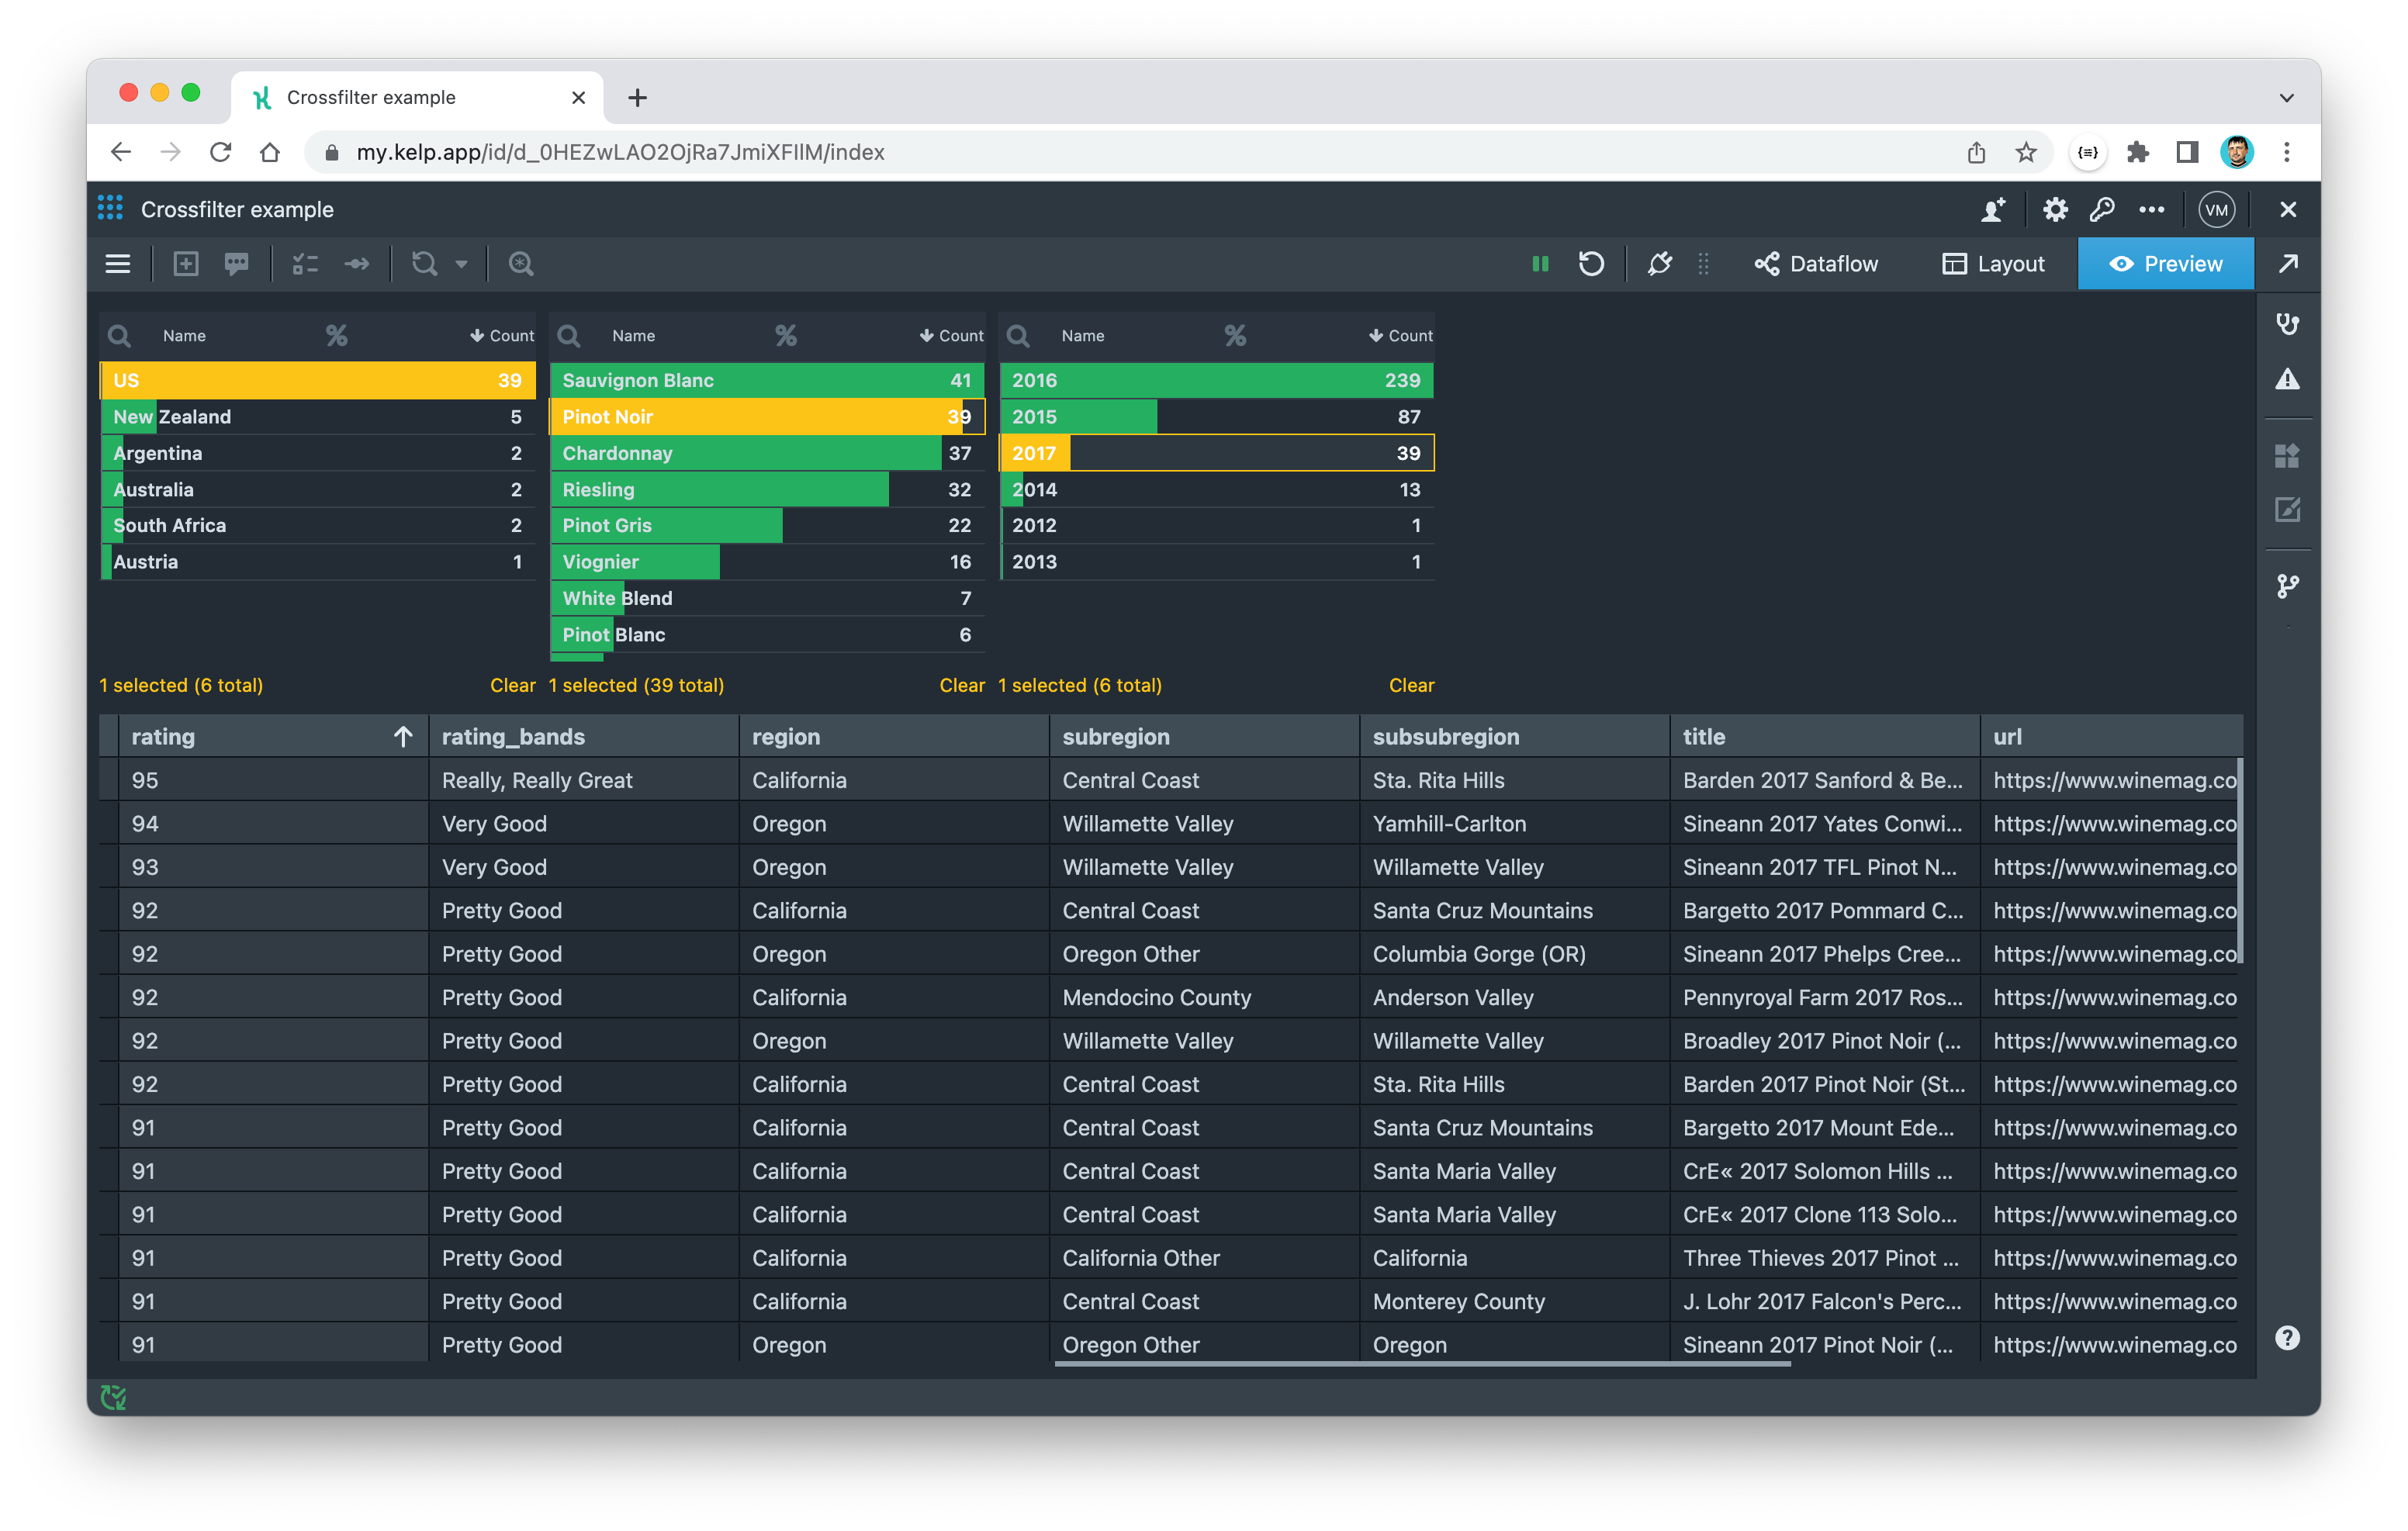
To see the Crossfilter in action, place all the widgets on the Layout and then switch to Preview tab.
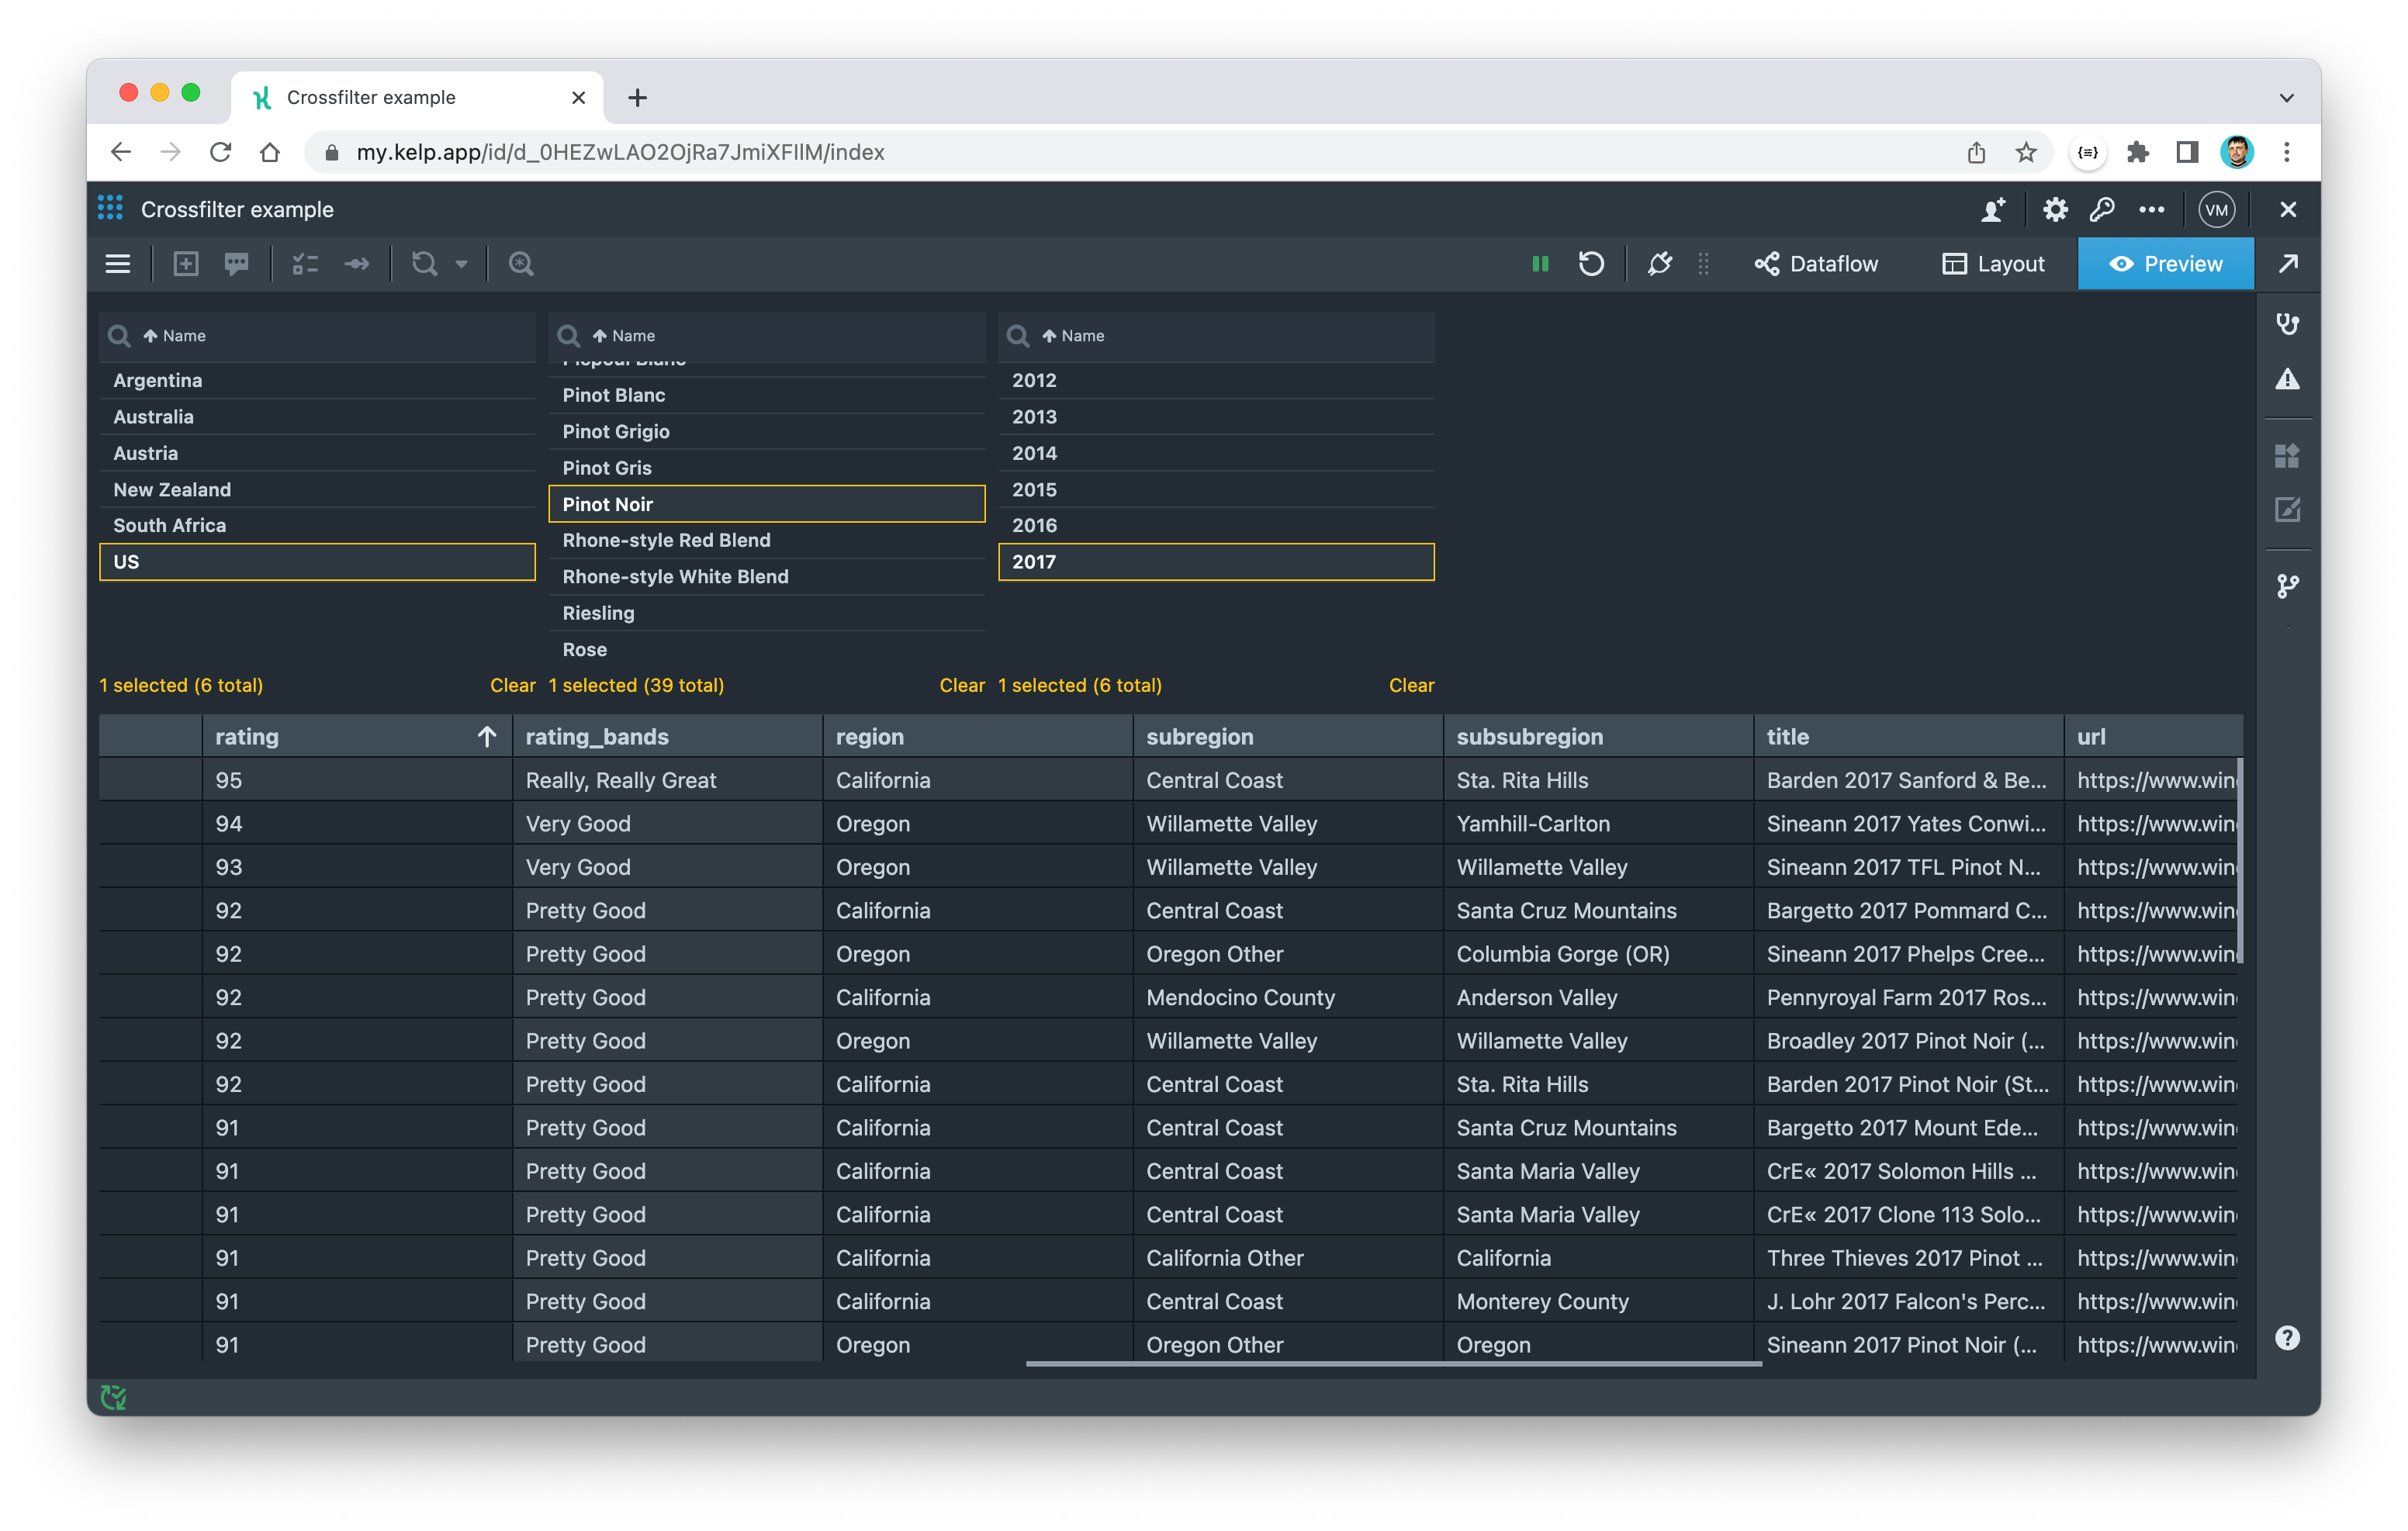
Now, with the power of Crossfilter, we can quickly answer our initial question and many others like it. Feel free to play around with the app and notice how a selection in one list narrows down the other lists. This quick cross-filtering is where the name Crossfilter comes from.
Measure
We can provide even more information in our lists by overlaying any measure we can calculate from the dataset. To do this, we need to apply a function over items grouped by each dimension. These functions are also known as aggregation functions.
The Crossfilter Dimension component has an aggregations port, which we can use to pass aggregation functions to the component. To configure these functions, we need the Crossfilter Aggregation component. To set it up, we simply select the field to aggregate by and the type of function to aggregate with. For a count, we can set the field to something unique for each wine, such as id, and select "Count" as the aggregate function type.
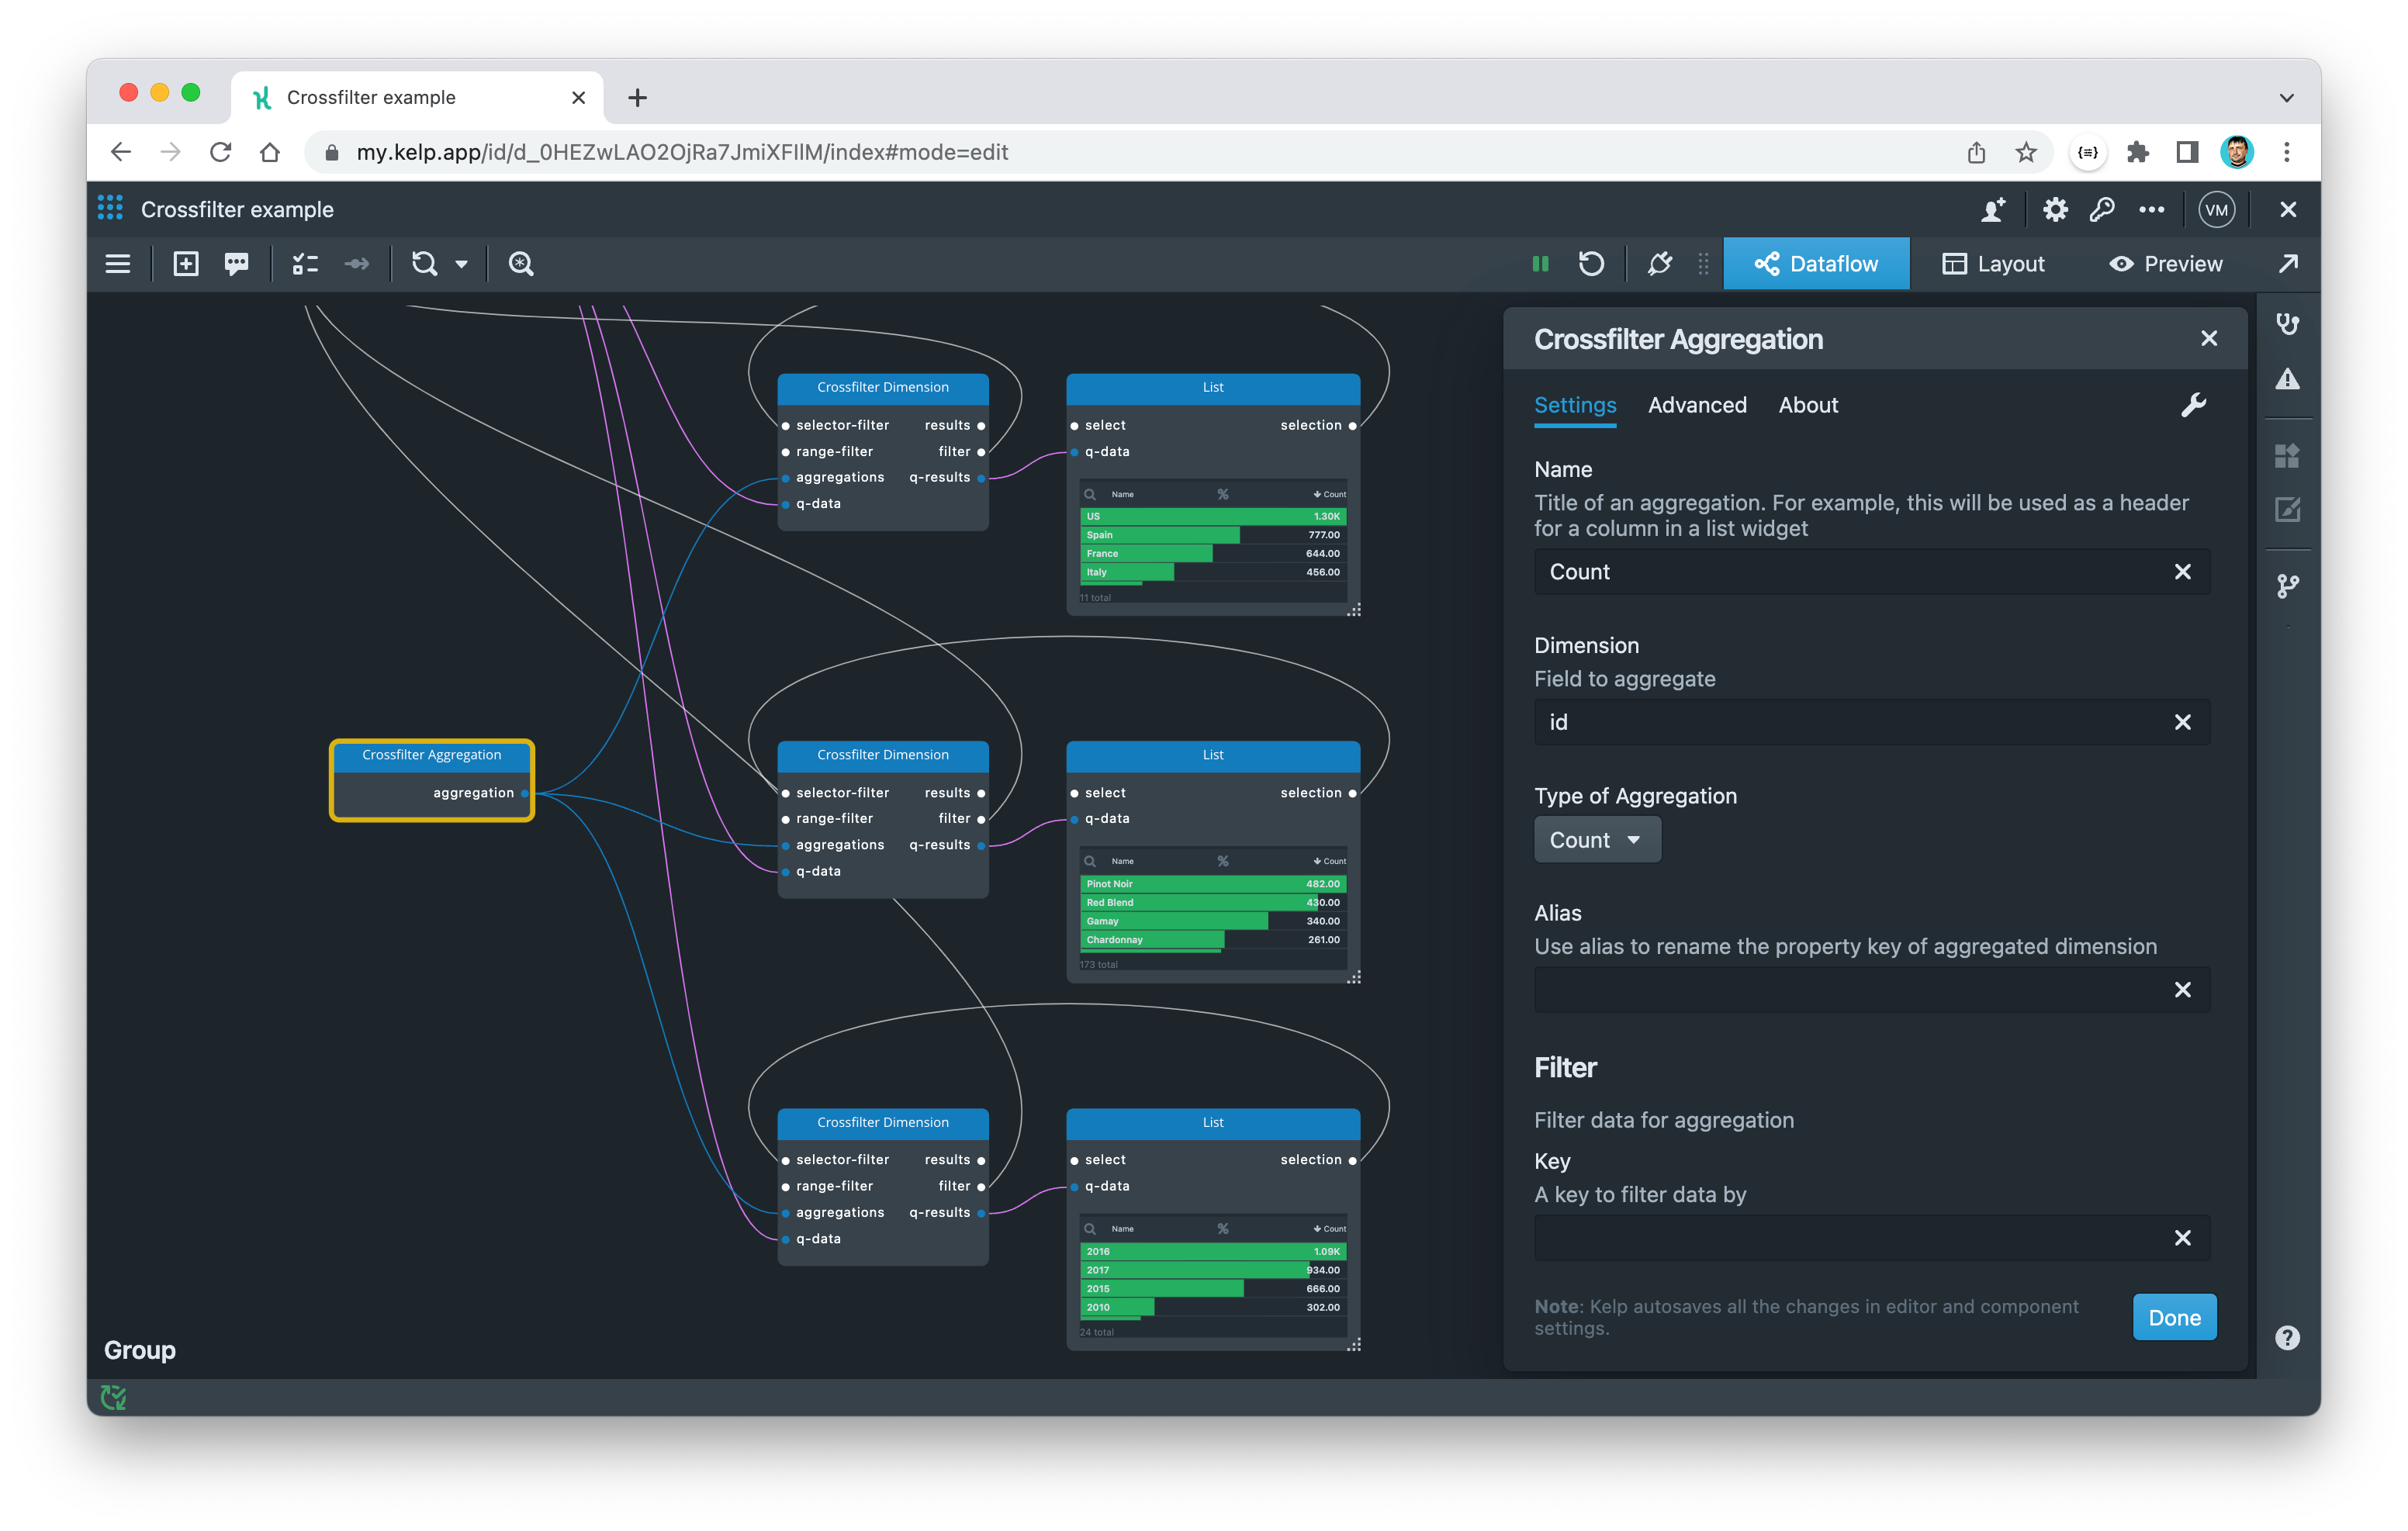
Switch to preview to see the count measure overlaid on top of each item in the List widgets. This gives you an additional clue for analyzing your data.
This example of Crossfilter is a complete and practical solution for analyzing data with multiple dimensions. With the techniques covered in this article, you can now create interactive apps that filter and refine datasets to answer specific inquiries. By using Crossfilter, you can incrementally slice and dice data until the intended result is reached.
In the next article, we'll explore more complex uses of Crossfilter. For example, we'll look at how to use interactive histograms with Crossfilter.
References
- http://crossfilter.github.io/crossfilter/ - a community fork of the original Crossfilter project developed by Square, Inc.
POSTED IN:


Introducing Kelp
We are excited to introduce you the public beta release of Kelp. We take a closer look at the platform’s features, including its streaming dataflow, visual programming, and seamless integration with data sources. Follow along as we explore how Kelp.app can help you create interactive and engaging data apps.
