

Numerous businesses are drowning in data but starving for insights. As a result, they are compelled to be quick on their feet and rely on more up-to-date data. Gradually, companies transition from using mainly strategic business intelligence based on historical data, to real-time or near real-time operational intelligence focused on shorter time frames. This shift is prevalent in a wide variety of industries, functions, and verticals, and not just limited to businesses that operate around the clock.
However, existing tools for BI and analytics, tailored for historical analysis, are no longer fast or agile enough to support real-time operational use cases. They’re designed for static view-only reporting that’s produced infrequently and requires a lot of data and querying. They don’t support streaming real-time data and typically work with a single database.
Building applications that support a mixture of real-time and batch data sources that are highly interactive is notoriously a challenging problem. It requires high-skilled backend and frontend engineers, many months of development, and at times, a fortune to develop. And it’s tough to iterate and maintain those applications.
Kelp: solution for real-time analytics
That’s where Kelp comes into play! It’s a visual development platform designed for building highly interactive operational and real-time applications. It abstracts tons of boilerplate code for working with various data sources and complex user interactions into composable building blocks that are easy to connect and reason about. It lets developers focus on the interaction logic and data presentation.
Multi-source connectivity
Kelp provides multi-source connectivity that supports integrations with various types of datasources, including batch REST, GraphQL, and JDBC databases, and streaming protocols like SSE and Kafka, allowing the server to push data continuously to the client.
Streaming dataflow
Additionally, it has an event streaming architecture with functional reactive components on the client side to support complex real-time and asynchronous data updates and user interactions, giving developers more control and flexibility over the UX.
Visual programming
Kelp has a visual programming interface that makes creating and understanding data flow and processing steps simple, allowing developers to focus on the interaction logic and data presentation.
Interactive data visualizations
Kelp provides interactive data visualizations and composable components specifically designed for complex visualizations, outperforming traditional BI tools that can only display static reports.
Streamlined one-click deployment
Kelp provides a streamlined one-click deployment process. The platform manages all the underlying infrastructure to ensure the apps are highly available, scalable, and secure, so developers can focus on building great applications.
Safety and security
Kelp provides a secure coding environment and dependable data connections, safeguarding your information and secrets. With Kelp, you have granular control over user access to applications and resources, allowing you to manage permissions with a high degree of precision.
Advantages of using Kelp
Using Kelp has numerous advantages. For starters, it allows you to build data apps faster using visual programming and composable components. You can also create highly interactive UIs and visualizations that enable you to unearth deeper insights from your data. Plus, Kelp provides more flexibility and agility to adapt to changing business needs and data sources while developing modular, scalable, and easily maintainable applications. With Kelp, you can lower costs and accelerate your time-to-market.
But, like any platform, Kelp has some potential limitations. Some non-technical usage training may be required to understand the platform better. Additionally, the predefined set of UI components may potentially limit the expressiveness of the interface, although Kelp supports creating custom components.
Conclusion
In conclusion, Kelp is an outstanding visual development platform that fills the gap left by traditional BI and analytics tools. It provides multi-source connectivity, streaming data flow, visual programming, interactive data visualizations, and composable components. By using Kelp, you gain more flexibility and agility to adapt to changing business needs and data sources.
Why not explore and try Kelp for yourself? Sign up for free at https://kelp.app and join our Slack to start developing interactive data apps.
POSTED IN:


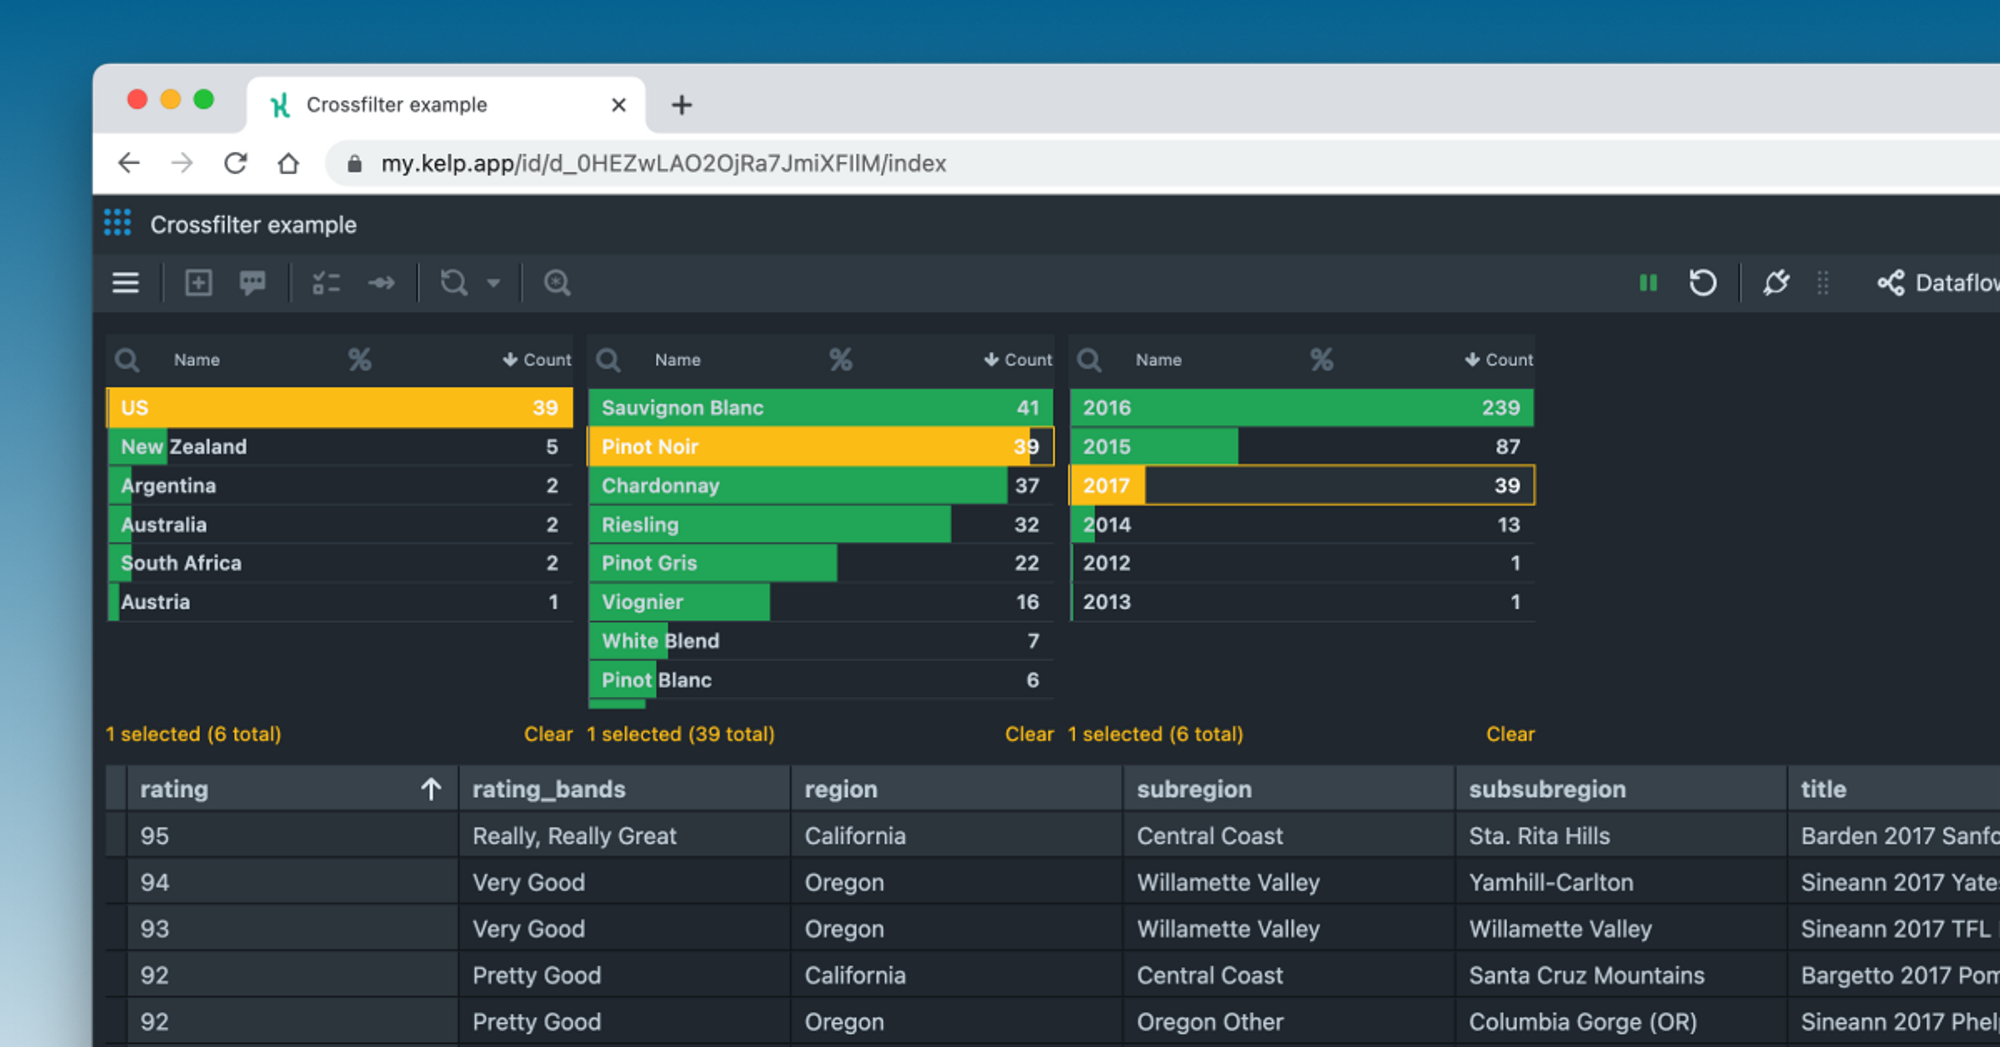
Slicing and dicing data with Crossfilter
Crossfilter is a powerful tool for interactive data visualization that allows you to slice and dice your data until you find the intended result. In this article, you’ll learn how to use Crossfilter within Kelp to build an interactive dashboard with a wine review dataset.
